Fig. 11.
Download original image
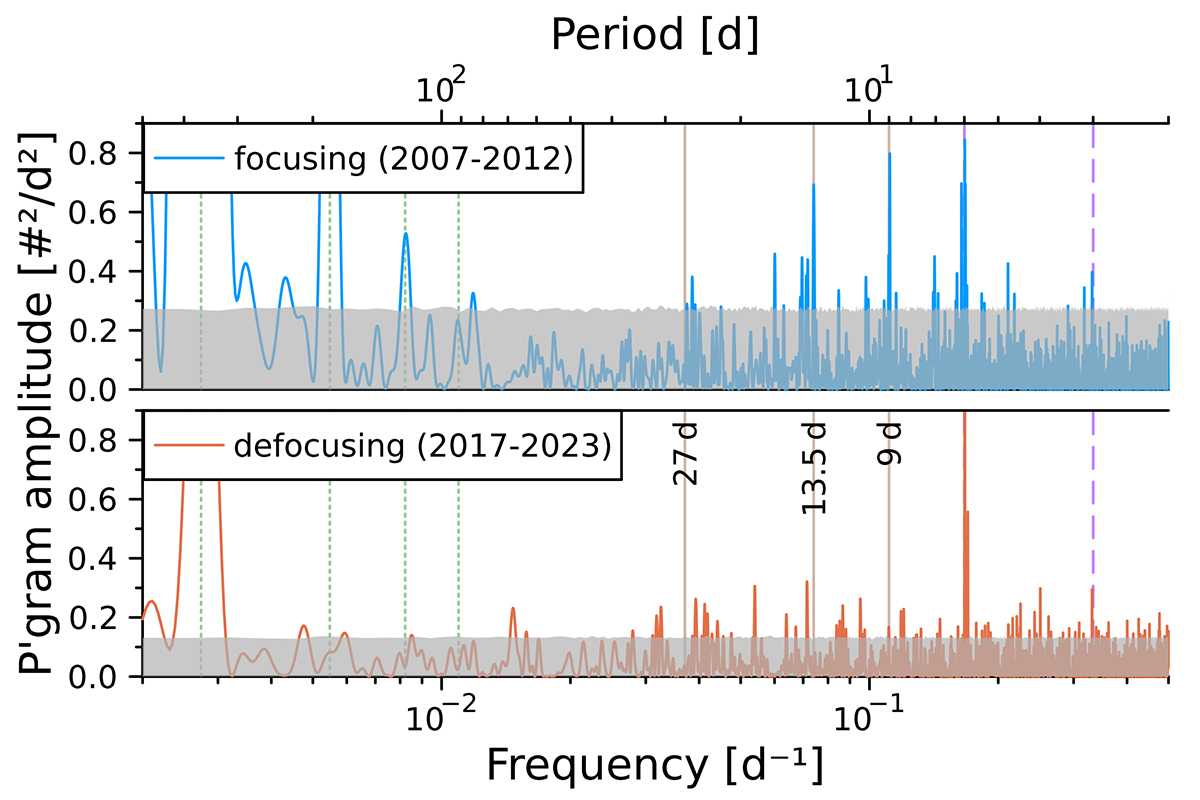
Periodograms of the daily number of dust impacts with morphological types A and B during six years in the focusing phase (2007–2012, blue curve, top panel) and six years in the defocusing phase (September 2017 to August 2023, red curve, bottom panel). The two panels are scaled identically; the estimated 95% significance thresholds are indicated by grey shaded areas. Frequencies of interest are marked by vertical lines as in Fig. 9.
Current usage metrics show cumulative count of Article Views (full-text article views including HTML views, PDF and ePub downloads, according to the available data) and Abstracts Views on Vision4Press platform.
Data correspond to usage on the plateform after 2015. The current usage metrics is available 48-96 hours after online publication and is updated daily on week days.
Initial download of the metrics may take a while.