Fig. 10.
Download original image
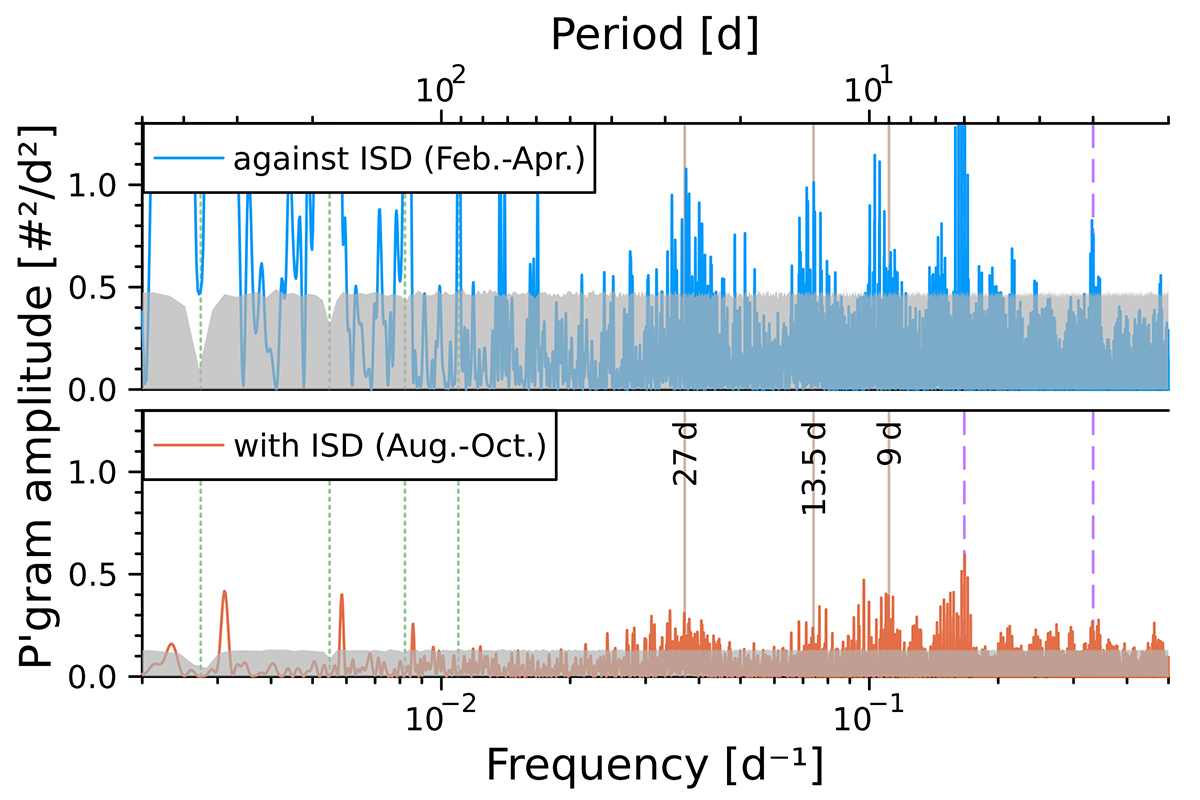
Periodograms of the daily number of dust impacts with morphological types A and B for the three months of each year that correspond either to the orbital segment against the ISD inflow (February to April, blue curve, top panel) or with the ISD inflow direction (August to October, red curve, bottom panel). The two panels are scaled identically; the estimated 95% significance thresholds are indicated by grey shaded areas. Frequencies of interest are marked by vertical lines as in Fig. 9.
Current usage metrics show cumulative count of Article Views (full-text article views including HTML views, PDF and ePub downloads, according to the available data) and Abstracts Views on Vision4Press platform.
Data correspond to usage on the plateform after 2015. The current usage metrics is available 48-96 hours after online publication and is updated daily on week days.
Initial download of the metrics may take a while.