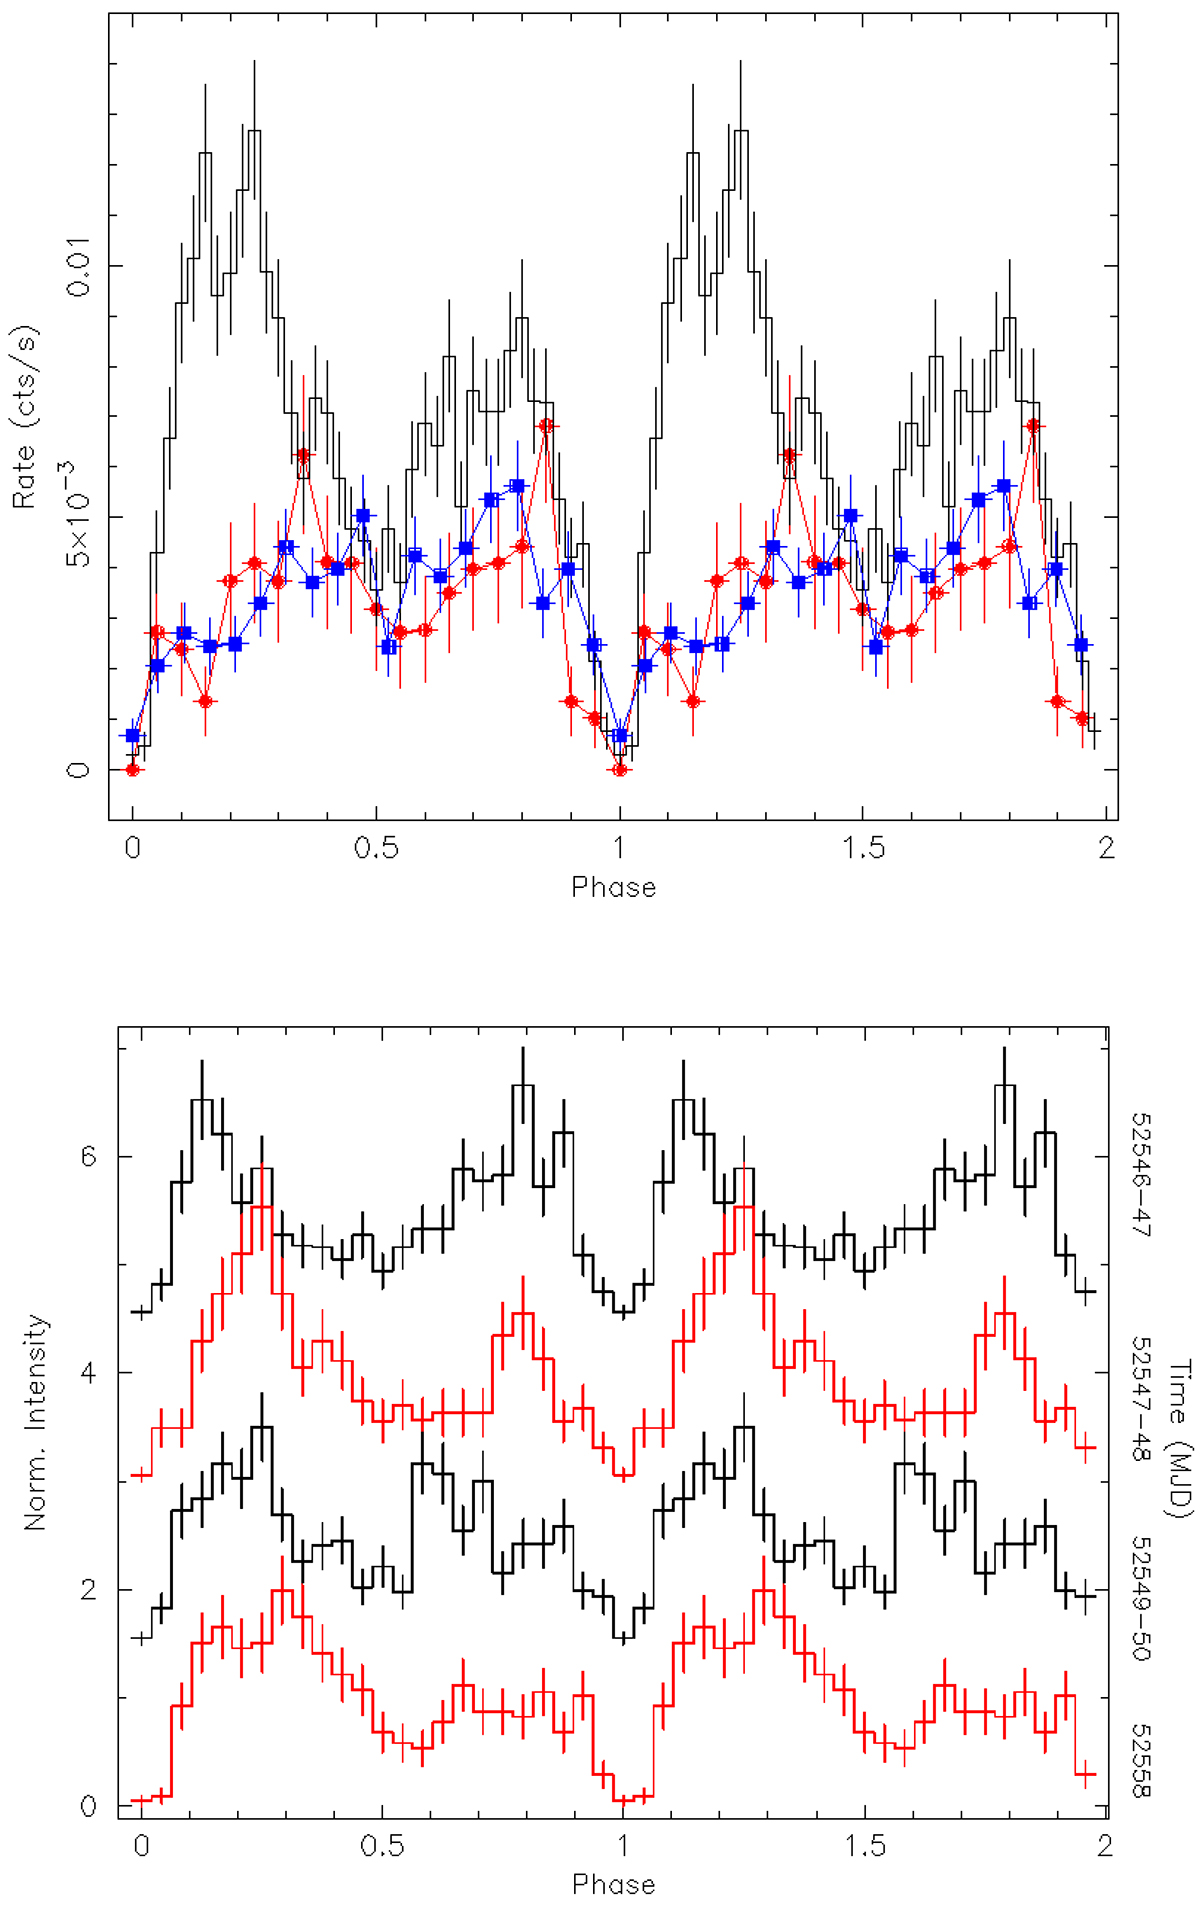
Fig. 6.
Download original image
Chandra ACIS eclipse profiles of W2, folded to the best period of P = 8649 s. Top panel: profiles for the three different epochs where the modulation was detected: 2000 (red line and filled circles), 2002 (black lines), and 2014 (blue line and filled squares). A correction of about 20% was applied to the 2000 datasets in order to take into account the difference in CCD efficiency between ACIS-I and ACIS-S. We used the reference epoch MJD 52551.999(1) (1σ c.l.) for the 2002 datasets, while the 2000 and 2014 light curves have been arbitrarily shifted along the x-axis in order to align the minima, corresponding to the 8-min eclipse. All light curves have 20 phase-bins of ∼432 s duration each. Bottom panel: folded light curves of the four longest observations, carried out in 2002 a few days apart from each other. From top to bottom: ObsID. 2735, 2736, 2737 and 2738. The profiles are complex and variable on time scales of less than a day.
Current usage metrics show cumulative count of Article Views (full-text article views including HTML views, PDF and ePub downloads, according to the available data) and Abstracts Views on Vision4Press platform.
Data correspond to usage on the plateform after 2015. The current usage metrics is available 48-96 hours after online publication and is updated daily on week days.
Initial download of the metrics may take a while.