| Issue |
A&A
Volume 693, January 2025
|
|
|---|---|---|
| Article Number | A107 | |
| Number of page(s) | 10 | |
| Section | Galactic structure, stellar clusters and populations | |
| DOI | https://doi.org/10.1051/0004-6361/202451217 | |
| Published online | 09 January 2025 | |
A deep Chandra study confirms diffuse nonthermal X-ray emission from the globular cluster Terzan 5
Physics Department, CCIS 4-183, University of Alberta,
Edmonton,
AB,
T6G 2E1,
Canada
★ Corresponding authors; This email address is being protected from spambots. You need JavaScript enabled to view it.
; heinke@ualb erta.ca
Received:
21
June
2024
Accepted:
2
December
2024
Abstract
Context. Diffuse X-ray emission has been detected from a few Galactic globular clusters (GCs), but its nature remains largely unclear. The GC Terzan 5 was previously found to show a significant diffuse thermal X-ray excess from its field, likely contributed by the Galactic background, and a nonthermal component described by a power-law model with photon index Γ ~ 1.
Aims. With over 16 times the accumulated Chandra exposure time compared to a prior study, we reexamined and verified the diffuse X-ray emission from the field of Terzan 5, which enabled us to place constraints on its nature.
Methods. We analyzed all available useful Chandra observations of Terzan 5, including 18 observations over a span of 13 years, with a total exposure time of 641.6 ks. To study the diffuse X-ray emission, we focused on four annular regions with an equal width of 0.72 arcmin centered on Terzan 5 (0.72–3.60 arcmin), from which we extracted and analyzed the X-ray spectra after removing point sources and instrumental backgrounds.
Results. We confirm a significant diffuse X-ray excess from the field of Terzan 5 in the band 0.8–3 keV. After constraining the contribution from the local X-ray background, we find a diffuse X-ray component that is genuinely associated with Terzan 5 and can be well described by a power-law model. More interestingly, the fitted photon indices show a significant increase from Γ = 1.96 ± 0.18 in the inner region to Γ = 3.48 ± 0.71 in the outer region. The diffuse X-rays are also well fit by a thermal bremsstrahlung model, with plasma temperatures declining from kT ∼ 3 keV to kT ∼ 1 keV.
Conclusions. We suggest that synchrotron radiation from the combined pulsar winds of Terzan 5’s millisecond pulsar population is a possible origin of the observed diffuse X-ray emission but that the sharp steepening in the spectra cannot be produced solely by synchrotron cooling. Other radiation processes, like thermal bremsstrahlung, may also contribute to the diffuse X-rays.
Key words: X-rays: diffuse background / globular clusters: individual: Terzan 5
© The Authors 2025
 Open Access article, published by EDP Sciences, under the terms of the Creative Commons Attribution License (https://creativecommons.org/licenses/by/4.0), which permits unrestricted use, distribution, and reproduction in any medium, provided the original work is properly cited.
This article is published in open access under the Subscribe to Open model. This email address is being protected from spambots. You need JavaScript enabled to view it. to support open access publication.
1 Introduction
Globular clusters (GCs) are dense, gravitationally bound stellar systems composed of an old stellar population. As a consequence of high stellar densities and interaction rates, GCs dynamically produce some kinds of X-ray sources (see, e.g., Pooley et al. 2003; Heinke et al. 2003c; Bahramian et al. 2013), notably low-mass X-ray binaries (LMXBs) with neutron stars accreting from companion stars. Some 22 LMXBs in Galactic GCs have been seen in a bright state, LX > 1035 erg s–1 (Bahramian & Degenaar 2023), and most of them show transient bright outbursts with durations on the order of a month. There is also a much larger population of quiescent LMXBs, LX < 1034 erg s–1, that have not yet been seen in outburst (Heinke et al. 2003c; Guillot et al. 2009). Other X-ray sources in GCs include cataclysmic variables, including an accreting white dwarf (Edmonds et al. 2003), chromospherically active binaries composed of normal stars (Dempsey et al. 1997; Grindlay et al. 2001; Bassa et al. 2004; Heinke et al. 2005), and millisecond pulsars (MSPs). MSPs are descendants of LMXBs, and like them are typically produced dynamically in dense clusters (Hui et al. 2011; Bahramian et al. 2013). MSPs are typically identified via their radio pulsations (e.g., Lorimer 2008). However, their substantial nonthermal gamma-ray emission has also been detected in several GCs (e.g., Abdo et al. 2009, 2010), including Terzan 5 (Kong et al. 2010), which has the highest known population of MSPs of any cluster (49; Padmanabh et al. 2024).
In addition to X-ray emission originating from point sources, diffuse X-ray emission has also been reported in the direction of a few GCs. Extended diffuse X-rays from the core are in many cases likely composed of many faint unresolved point sources (as discussed for 47 Tuc by Grindlay et al. 2002; NGC 6440 by Pooley et al. 2002; M80 by Heinke et al. 2003b; and for ten different clusters by Hui et al. 2009).
More interesting is diffuse X-ray emission that is spatially distinct from the known point sources and thus unlikely to be produced by fainter point sources. For example, Okada et al. (2007) detected diffuse Chandra X-ray emission near (within a few arcminutes of, but not centered on, the cluster) six GCs, including 47 Tuc (see also Krockenberger & Grindlay 1995 for a ROSAT detection), NGC 6752, M5, Omega Centauri, M80, and NGC 6266. Several diffuse X-ray sources are known to be background sources. Okada et al. (2007) identify the extended X-ray source toward ω Cen as a cluster or group at redshift 0.08 based on a thermal plasma fit with redshift free and the fact that the fitted parameters (e.g., temperature and radius) are generally consistent with what is expected for a background galaxy cluster. The diffuse X-ray source initially thought to be associated with 47 Tuc was subsequently identified as a background cluster of galaxies with a redshift of 0.34±0.02 (Yuasa et al. 2009). Heinke et al. (2020) identified extended X-ray emission projected onto NGC 6366 (Bassa et al. 2008) with a background cluster of galaxies. Cheng et al. (2021) identified the two extended X-ray sources near NGC 6752 (Okada et al. 2007) as galaxy clusters at z = 0.239 and 0.375.
Wu et al. (2014) detected diffuse X-ray emission within the half-light radius of 47 Tuc via Chandra observations, fitting the spectrum with a power-law (PL) model with a photon index of Γ ~1.0 plus a plasma model with a plasma temperature kT ~ 0.2 keV. They suggest that this X-ray emission may be produced by a shock between the stellar wind and the interstellar medium, and/or a pulsar wind from the MSPs in the cluster.
Terzan 5 is the GC with perhaps the most interesting detection of diffuse isotropic X-ray emission. Eger et al. (2010) analyzed 31 ks of Chandra observations and found an excess of diffuse X-ray emission outside the half-light radius of Terzan 5. The spectral analysis of this diffuse emission indicated a nonthermal component (after subtracting the diffuse Galactic background emission; Ebisawa et al. 2005), which can be fitted by a PL model with Γ = 0.9 ± 0.5 (Eger et al. 2010). However, with limited statistics, the origin of this diffuse X-ray emission was unclear. Subsequently, Eger & Domainko (2012) searched for diffuse X-ray emission from the fields of another six GCs (M 62, NGC 6388, NGC 6541, M 28, M 80, and NGC 6139) that were detected in γ rays. However, none of the six GCs exhibited a significant excess of diffuse X-rays.
While the nature of diffuse X-ray emission from GCs is still unclear, several scenarios have been proposed to interpret its origin. For instance, the relative motion between a GC and the Galactic plane might produce a bow shock along the direction of motion of the cluster, generating soft, thermal X-ray emission (Krockenberger & Grindlay 1995; Okada et al. 2007). Nonthermal X-ray emission can be produced by highly energetic electrons through synchrotron radiation (SR). Also, inverse Compton emission can generate nonthermal X-rays in GCs by scattering visible photons from charged particles accelerated in shock fronts (Bell 1978; Blandford & Eichler 1987), as proposed by Krockenberger & Grindlay (1995). And the populations of MSPs residing in GCs are considered to continuously provide such seed electrons (Bednarek & Sitarek 2007).
Several works have attempted to model a wind of relativistic electrons from a population of pulsars in GCs, fitting these data to the diffuse X-ray emission along with other multiwavelength constraints. Key to this modeling is the detection of Terzan 5 in the GeV range (Kong et al. 2010; Abdo et al. 2010), which is generally attributed to the sum of pulsed curvature radiation from electrons within the pulsar magnetospheres, though alternative, inverse Compton, interpretations have been suggested (Cheng et al. 2010). TeV gamma rays from near Terzan 5 have also been detected (H. E. S. S. Collaboration 2011) and suggested to be related to a pulsar wind from the cluster (see particularly Bednarek & Sobczak 2014). Finally, extended radio emission has been detected near Terzan 5, but given the complexity of the Galactic plane in radio, it is not certain that the extended radio emission is associated with Terzan 5 (Clapson et al. 2011).
Detailed state-of-the-art modeling of the high-energy emission from particles accelerated by pulsars in Terzan 5, and fit to constraints on the diffuse X-ray, GeV, and TeV data, has been performed by Kopp et al. (2013) and Ndiyavala et al. (2019). In these models, X-rays are produced by SR, GeV gamma rays by curvature radiation, and TeV gamma rays by inverse Compton radiation from the combined pulsar wind. Kopp et al. (2013) were unable to replicate the spectral index of the diffuse X-ray emission from Terzan 5 as found by Eger et al. (2010). Ndiyavala et al. (2019) were able to approach the inferred X-ray spectral index, but at the cost of requiring a new spectral energy density component, high-energy synchrotron radiation (HESR) with a cutoff energy of 100 keV. Reaching these energies required Ndiyavala et al. (2019) to place these electrons inside the magnetospheres of the Terzan 5 pulsars, to increase the magnetic field enough to reach the required maximum energy. The downside of this scenario is that hard X-rays from the population of Terzan 5 pulsars would be identified as bright point sources unless they are exceptionally numerous. For instance, spreading hard X-rays across an area of 40 square arcminutes would require 144 000 pulsars if they are distributed evenly at one per square arcsecond. This makes the HESR scenario in its current iteration very unlikely and motivated us to double-check the diffuse X-ray data on Terzan 5.
Since the diffuse X-ray emission from Terzan 5 was first reported by Eger et al. (2010), a number of Chandra observations of Terzan 5 have been performed (e.g., Degenaar et al. 2015), motivating us to reanalyze and verify the existence of this emission. We retrieved all the available and useful Chandra observations of Terzan 5 and conducted a deep study of the diffuse X-ray emission from the field of Terzan 5. We also investigated the nature of the diffuse X-ray emission.
This paper is organized as follows. In Sect. 2 we describe the process of Chandra data selection, preparation, and reduction. We present primary spectral fitting results and analysis in Sect. 3. Finally, we discuss the nature of the diffuse X-ray emission from Terzan 5 and draw conclusions in Sect. 4.
2 Data preparation and reduction
We prepared and reduced the Chandra datasets using CIAO1 (version 4.15.2 with CALDB 4.10.7; Fruscione et al. 2006), the software package developed by the Chandra X-ray Center (CXC).
2.1 Chandra observations of Terzan 5
Terzan 5 has been observed by Chandra Advanced CCD Imaging Spectrometer (ACIS) in the timed exposure mode and FAINT telemetry format 24 times, with a total exposure time of 833.0 ks over a time span of more than 20 years (see Table 1). Among these observations, six (ObsIDs 654, 655, 11051, 12454, 13708, and 27736) included an X-ray binary in a bright transient outburst (e.g., Heinke et al. 2003a; Altamirano et al. 2012; Bahramian et al. 2014), which severely affected the detectability of diffuse emission in the field of Terzan 5. For our purpose in this work, therefore, these six observations were not included in the following analysis. In addition, ObsID 3798 suffered from strong background flares (described in Heinke et al. 2006), leading to significantly increased background levels compared to quiescent background periods. However, this observation is eligible for our research purpose after removing the periods of flaring background (see Sect. 2.3.1), and hence it was used in this work.
Consequently, 18 observations were selected for further analysis. We obtained the datasets of these 18 observations from the Chandra Data Archive2, and reprocessed them to generate new level=2 event files using the chandra_repro script3. We note that the remaining observations were all observed using solely the ACIS-S3 chip, with other chips turned off, except for ObsID 10059, which used the S2 and S4 chips as optional CCDs. However, we restricted our attention to the S3 chip for observation 10059 to maintain consistency. Observations 10059, 14475, 14476, 14477, 14478, and 14479 were performed in a sub-array mode, where only partial regions of the S3 chip were used to collect data.
2.2 Point source exclusion
Given that our interest in this work is the diffuse X-ray emission in the field of Terzan 5, it is therefore necessary to remove emission from any point sources. Point source exclusion is also required for checking for background flares.
There are several existing catalogs of point sources in Terzan 5 (e.g., Heinke et al. 2006; Bahramian et al. 2020). Specifically, Heinke et al. (2006) used observation 3798 with a total good time of 35.3 ks and detected 50 and 77 X-ray sources within and outside the half-light radius (Rh) of Terzan 5, respectively. However, the currently available observations of Terzan 5 are much deeper than the single observation used in Heinke et al. (2006), and hence one can expect more sources to be detected in the field of Terzan 5 with a longer exposure time. On the other hand, Bahramian et al. (2020) used a compilation of datasets similar to those used in this work, and detected 188 confident sources with a total exposure of 597.0 ks within a 1-arcminute- radius region. The region covered in their work, however, is too limited for our study, as we are interested in a broader area out to a few arcminutes from the center of Terzan 5. Therefore, to sufficiently exclude point sources, we performed source detection in the field of Terzan 5 with the combined observations in this work.
We first ran the merge_obs script4, reprojecting and combining the 18 selected observations to create a merged event file, exposure maps, and exposure-corrected images. We then applied wavdetect5, a Mexican-hat wavelet source detection tool, with scales of [1, 1.4, 2, 4, 8] pixels and a significance threshold of 10–6 (suggesting one false source per 10–6 searched pixels), to detect sources in the field and generate a corresponding source list. We found a total of 333 sources outside the half-light radius and in the field of view (FoV) of the combined image. To better account for the Chandra point spread function (PSF), we implemented the psf module6 to estimate the size of the Chandra PSF at the off-axis positions of the detected sources for each observation separately. We found that PSF-corrected regions obtained with an encircled energy fraction of 95% at 1.5 keV were sufficient to exclude the emission from those point sources.
2.3 Background removal
Instrumental background should be removed carefully to ensure that the final extracted products (e.g., spectra) contain (almost) purely the information about diffuse X-ray emission. There are four components to the ACIS background7: (1) background flares caused by charged particles, (2) cosmic X-ray background (CXB), principally from distant active galactic nuclei, (3) noncelestial X-ray background (NXB), and (4) read-out artifacts.
We note that read-out artifacts are only significant for strong X- ray sources, whereas the detected X-ray sources in this work are relatively faint, making read-out artifacts negligible. Therefore, read-out artifacts were not taken into account in the following analysis.
Available Chandra observations of Terzan 5.
2.3.1 Flaring background
To remove intervals with background flares, we followed the lc_clean routine in a CIAO science thread8, which also removes periods of anomalously low count rates. In brief, for each observation, we extracted the light curve of the corresponding FoV, using dmextract. We then applied lc_clean to select those quiescent regions of the light curve and create a new good time interval file, which was used to filter the corresponding event file to get the flare-free observation. In particular, since observation 3798 suffered from strong flares, for this case we forced the mean option of Ic_clean to be 0.37 counts s−1 based on its count rate distribution. The filtered exposure time of each observation is listed in Table 1, while the total filtered exposure time is 641.6 ks. Figure 1 (left panel) shows a combined X-ray image of Terzan 5 in the energy band of 0.5–7 keV using those filtered event files.
2.3.2 CXB and NXB
The event files filtered with good time intervals are essentially clean. However, the signals of CXB and NXB that are not relevant to the diffuse emission in Terzan 5 still remain in the event files. To determine and subtract the NXB for further spectral analysis, we used the blanksky script to create blank-sky background files using observations in which the ACIS detector is stowed9. Each background file was scaled to match the background particle count rates in the band 9–12 keV, where the flux is almost entirely due to particle background (see Hickox & Markevitch 2006). The obtained blank-sky files were subsequently used to extract the spectra of the NXB.
We note that the blanksky script is able to generate background files containing both NXB and CXB. However, those files are created using observations of relatively empty fields with the conditions of high galactic latitude (Ibl>20º) and little soft X-ray emission, where soft (≲2 keV) cosmic X-rays are barely absorbed. Terzan 5, however, is located near the Galactic Center, and the hydrogen column density (NH) toward it is about 2.0 × 1022 cm–210. Thus, a large fraction of soft cosmic X-rays in the direction of Terzan 5 is extincted. Using the background files containing both NXB and CXB to extract background spectra causes severe over-subtraction from the observations in the low- energy band. Therefore, to properly subtract the CXB as well as other Galactic diffuse emission from the local environment around Terzan 5, we defined the diffuse X-ray emission from the outer region of Terzan 5 (i.e., Ring 4; see below) as the local X-ray background (LXB), where the X-ray emission is assumed to be unassociated with Terzan 5. (This indicates that we may miss the most extended diffuse emission associated with Terzan 5; our results are a lower limit for this emission.) We then performed spectral fitting to constrain its properties for subtraction purposes (see Sect. 3.2).
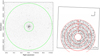 |
Fig. 1 Chandra X-ray images of Terzan 5. Left: exposure-corrected, combined Chandra X-ray image of Terzan 5 in the band 0.5–7 keV. The small and large green circles show the half-light radius (0.72 arcmin) and five times the half-light radius (3.60 arcmin), respectively, centered at RA=17:48:04.80, Dec=−24:46:45 (Harris 1996, 2010 edition). Right: region of interest and the spectral extraction regions of observation 3798 for an example. See the region definitions in Sect. 2.4. The outer square shows the FoV of the observation, while the regions of the four annuli within the FoV (ring numbers annotated) show the spectral extraction areas. Ring 4 was used to extract the Terzan 5 background and is marked with a dashed circle. The X-ray image is generated in the band 0.5–7 keV with smoothed 0.492-arcsecond pixels. North is up, and east is to the left. |
2.4 Spectral extraction
To extract the X-ray spectra of the field of Terzan 5 from the observations, we first defined the region of interest to be an annular region from 1 Rh to 5 Rh (i.e., 0.72–3.60 arcmin) from the center of Terzan 5. We chose these boundaries for two reasons: first, the diffuse X-ray emission in the region within the half-light radius can be largely explained as a result of unresolved sources due to the high source density; and second, the region within 5 Rh is fully contained in the combined FoV. Then we divided the region of interest into four annuli with an equal width of 0.72 arcmin (or 1 Rh ; see the right panel of Fig. 1 for an example), labeling the annuli as Ring 1 to Ring 4, progressing from the innermost to the outermost region. We then extracted spectra from these rings separately for each observation with point source exclusion and FoV restriction, using the specextract script for diffuse emission11. The background spectra were extracted from the blank-sky files using the same region definitions.
Since the aim point and roll angle are different in each observation, the FoVs and hence the actual areas used to extract spectra are also different. This effect could result in offsets in spectral intensities, especially for sub-array-mode observations. Therefore, to correct for the likely offsets, we calculated the actual area of each ring in each observation, and scaled each spectrum by the ratio of its actual area to the maximum actual area of the same ring(s) among all observations. We list the calculated actual areas of each annulus in each observation in Table A.1.
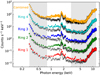 |
Fig. 2 X-ray spectra of four rings and their combination from ObsID 15615 of the Terzan 5 field, in the energy band 0.3–12 keV. The observed spectra (un-subtracted) are shown as colored dots, while the background spectra extracted from corresponding blank-sky files are shown as crosses, with photons grouped into 50 counts per bin. Shaded regions indicate where the observed and background spectra are almost indistinguishable. The spectra of each ring are scaled to provide adequate spacing for display purposes. |
3 Data analysis and results
We performed the data analysis using SHERPA (version 4.15.0; Freeman et al. 2001; Doe et al. 2007; Burke et al. 2022), CIAO’s modeling and fitting package.
3.1 The excess of diffuse X-ray emission
To validate the background removal and verify the existence of X-ray excess in the field of Terzan 5, we first compared the observed, un-subtracted spectra with the corresponding blanksky background spectra, for all the observations. For each observation, we investigated the spectra extracted from the four rings separately, and also their combination. Each spectrum was grouped into 50 photons per bin in the 0.3–12 keV band. The spectra of ObsID 15651, which has the longest exposure time, are shown as an example in Fig. 2.
The observed spectra are nearly indistinguishable from the blank-sky background spectra in the bands ≲0.8 keV and ≳3 keV, indicating that the observed X-rays from these two bands are almost entirely contributed by the NXB. This also implies that the blank-sky files are well-scaled to match the corresponding observations. Two prominent emission line features, centered at around 1.8 keV for Si and 2.1 keV for Au, can be seen from the spectra, which are dominated by the NXB12. Nevertheless, significant X-ray excesses are observed in the band 0.8–3 keV in each ring. Therefore, in the following spectral analysis, we only focused on the band 0.8–3 keV to ensure sufficient statistics and significance. We note that, for the Ring 1 spectra, the X-ray excess might reach up to ~5 keV (as shown in Fig. 2). However, for consistency and simplicity, we ignored the X-rays above 3 keV for all the spectral analysis.
Spectral fits of Ring 4 spectra with an absorbed PL model.
3.2 Spectral analysis
Given that the 18 Chandra observations used in this work have a time span of about 13 years, it is therefore inappropriate to create combined spectra for those observations for analysis, due to the accumulating contamination on the ACIS detectors and thus the changing corrections for this contamination13. Instead, we performed simultaneous fitting for these 18 datasets, allowing us to increase the significance of the fits without averaging spectra and responses. We implemented χ2 statistics (with variance computed from data amplitudes) and a Monte Carlo optimization method in the fitting process. We considered X-ray absorption by the interstellar medium toward Terzan 5 for all the spectral fits in this work, using the xstbabs model (TBABS) with wilm abundances (Wilms et al. 2000) and vern cross sections (Verner et al. 1996).
3.2.1 Local X-ray background fitting
As we aim to verify the diffuse X-ray emission that is truly associated with Terzan 5, it is necessary to identify and exclude any LXB, for instance from interstellar gas in our Galaxy along the line of sight. Therefore, we first fitted the spectra extracted from Ring 4, where the X-ray emission is assumed to represent the LXB, with a simple absorbed PL model (TBABS×PL), allowing the NH value to vary. The fitting results are summarized in Table 2. An example spectrum, and fit, of ObsID 15615 are shown in Fig. 3.
The Ring 4 spectra can be well described by a single PL model with a photon index Γ = 1.44 ± 0.20. The indicated unabsorbed X-ray surface flux in the band 0.5–6 keV is (3.96 ± 0.18) × 10–18 erg cm–2 s−1 arcsec−2. The best-fit NH value is 1.4 × 1021 cm−2, approximately an order of magnitude lower than the value toward Terzan 5, implying that most, if not all, of the diffuse X-ray emission from Ring 4 originates from the foreground relative to Terzan 5.
Intriguingly, the PL photon index of the LXB spectra is consistent with that of unresolved CXB spectra extracted from the Chandra Deep Field (CDFs) North and South observations, which are targeted toward regions of low NH and away from bright features in the Galactic emission ( Hickox & Markevitch 2006). The surface flux of the CXB from CDFs is 3.4 × 10⁻¹⁹ erg cm–2 s–1 arcsec–2 in the band 1–8 keV, about an order of magnitude lower than that of the LXB, which is expected since the CXB toward the Galactic Center area is much higher than the CXB toward the CDFs (see, e.g., Snowden et al. 1997). The LXB likely has significant contributions from the local hot bubble, the Galactic halo and corona, and unresolved Galactic sources, among others.
We did not fit the LXB with a two-temperature nonequilibrium ionization collisional plasma model, as done by Eger et al. (2010), as we found that an absorbed PL model can already adequately describe the spectra. Given that the LXB component is only used to subtract the foreground X-rays from the inner rings of Terzan 5, complex spectral fittings are unnecessary.
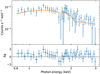 |
Fig. 3 Spectrum and the best fit of the diffuse X-ray emission (0.8–3 keV) extracted from Ring 4 of Terzan 5 from ObsID 15615 (see Sect. 2.4 fo2r the ring definition). The best-fit model is given by agle absorbed PL. Data are grouped into at least 50 photons per bin. |
3.2.2 Diffuse X-ray emission associated with Terzan 5
To identify the diffuse X-ray emission that is truly associated with Terzan 5, we analyzed the spectra extracted from the inner three rings, excluding the LXB contribution. However, instead of directly subtracting the LXB spectra from the inner rings’ spectra, we included the LXB contribution as a fixed component with the best-fit parameters in the fits, while the NH toward the LXB was still set to be a free parameter to allow for possible changes. We fixed the normalization (or flux) of the LXB contribution to each ring based on the area of each ring, to give the same normalization per unit area of the LXB for each of the inner rings as seen in ring 4. For the potential diffuse X-ray component from Terzan 5, we assumed the NH toward Terzan 5 to be fixed at 2.0 × 1022 cm–2.
We first fitted the spectra from the inner three rings with a double absorbed PL model: (TBABS×PL)LXB+(TBABS× PL)Ter5 , where LXB and Ter5 denote the diffuse X-ray components from the LXB and Terzan 5, respectively. The fitting results are listed in Table 3. We show the spectra and best fits of the inner three rings of ObsID 15615, as an example, in Fig. 4.
We found that, besides the diffuse X-ray emission from the LXB, significant X-ray emission is detected associated with Terzan 5 in the inner three rings, and well fit by an absorbed PL model. Moreover, the fitted photon indices increase from Γ = 1.96 ± 0.18 (Ring 1) to Γ = 3.48 ± 0.71 (Ring 3), indicating substantial steepening of the PL spectra from Ring 1 to Ring 3. The unabsorbed X-ray surface flux of the Terzan 5 diffuse emission declines gradually from around 9.7 × 10⁻¹⁸erg cm–2 s–1arcsec–2 in Ring 1 to 3.2 × 10⁻¹⁸ ergcm–2 s–1arcsec–2 in Ring 3, in the band 0.5–6 keV (see Fig. 5). On the other hand, there are no significant changes in the NH values toward the LXB. Additionally, we investigated the possible spatial variation of the diffuse emission by dividing Ring 1 into four quarters. No significant variation in the surface fluxes of those four quarters was found, indicating the diffuse emission is likely isotropic.
The fitted PL photon indices of Γ ≳ 2 may also indicate a thermal origin of the observed X-rays. In the thermal scenario, electrons can lose energy and radiate X-ray photons through bremsstrahlung radiation. To examine this possibility, we fitted the spectra by replacing the PL model with a bremsstrahlung model (BREM): (TBABS×PL)LXB +(TBABS×BREM)Ter5. The fitting results are listed in the lower panel of Table 3.
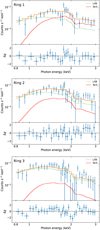 |
Fig. 4 Spectra and best fits of the diffuse X-ray emission (0.8–3 keV) extracted from the inner three rings of Terzan 5 from ObsID 15615. The dotted line and the dashed line show the X-ray components of the LXB and Terzan 5, fitted with absorbed PL models with independent NH values, respectively. The ring number is annotated in the upper-left corner. Data are grouped into at least 50 photons per bin. |
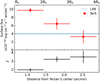 |
Fig. 5 Change in the unabsorbed surface flux (upper panel) and the photon index (lower panel) of the diffuse X-ray emission from Terzan 5 as a function of distance from the center of Terzan 5. The horizontal error bars show the spatial extent of the rings, and the vertical error bars show 1σ uncertainties. The unabsorbed surface flux of the LXB (subtracted from the Terzan 5 flux measurements shown) is also shown in the upper panel (dotted line with 1σ shaded region), which is assumed to be constant toward the Terzan 5 field. |
4 Discussion
4.1 Comparison with Eger et al. (2010)
Through spectral analysis of the spectra extracted from four rings around the center of Terzan 5, we successfully verified the existence of diffuse X-ray emission that is genuinely associated with Terzan 5 (Eger et al. 2010). Moreover, the Terzan 5 diffuse emission can be well described by an absorbed PL model, and more intriguingly, its spectra show significant steepening from the inner region to the outer region, with the best-fit photon indices increasing from around 2.0 to 3.5.
However, the PL photon indices of the Terzan 5 diffuse X- ray component found in this work are much softer than the one reported by Eger et al. (2010), who found a PL photon index of Γ = 0.9 ± 0.5 for the spectra of the diffuse emission between 0.83 arcmin and 3 arcmin in the 1–7 keV band. The discrepancy of photon indices between our work and Eger et al. (2010) may be caused by our different spectral model assumptions. Eger et al. (2010) applied a single, fixed NH value of 1 × 1022 cm–2 for the absorption of both their LXB component and Terzan 5 X- ray component, whereas we used separate NH values toward the LXB (allowed to vary) and Terzan 5 X-ray component (fixed at 2 × 1022 cm–2), respectively. If we use similar spectral model settings with those in Eger et al. (2010), the PL photon indices of the LXB and diffuse X-ray emission from Ring 1 are found to be Γ = 2.92 ± 0.12 and Γ = 0.39 ± 0.14, respectively, which are consistent with the results in Eger et al. (2010) within 1σ. However, we argue that it may not be safe to fix the NH value toward the LXB to be the same as the one toward Terzan 5. First, the LXB likely contains diffuse X-rays from different origins and locations, and therefore, fixing the NH value toward it may significantly alter the spectral fits. As mentioned by Eger et al. (2010), their choice to fix the NH value was a compromise due to the limited statistics in their spectra. However, in this work, we used much deeper Chandra observations toward Terzan 5 with significantly higher statistics, allowing us to easily treat NH as a free parameter. Indeed, the NH values toward the LXB inferred from spectral fits range from ~1.4 × 1021 cm–2 to ~3.3 × 1021 cm–2, almost an order of magnitude lower than the NH toward Terzan 5.
Spectral fits of the inner three rings.
4.2 The origin of the diffuse X-ray emission from Terzan 5
We found diffuse X-ray emission associated with Terzan 5 between 0.72 arcmin and 2.88 arcmin from Terzan 5 center, whose nature is of great interest. In this section we briefly discuss several scenarios of the origin of this diffuse X-ray emission. We adopt a distance to Terzan 5 from the Sun of 6.9 kpc (Harris 1996, 2010 edition) in the following. Hence, the unabsorbed X- ray luminosity of the diffuse emission from the inner three rings is (2.7 ± 0.5) × 1033 erg s–1 in the 0.5–6 keV band.
4.2.1 Contribution from unresolved point sources
We first looked into the contribution from unresolved point sources from the Terzan 5 GC. We adopted the spatial surface distribution of X-ray sources in Terzan 5 from Heinke et al. (2006):
![Mathematical equation: $S(r) = {S_0}{\left[ {1 + {{\left( {{r \over {{r_c}}}} \right)}^2}} \right]^{(1 - 3q)/2}},$](/articles/aa/full_html/2025/01/aa51217-24/aa51217-24-eq5.png) (1)
(1)
where S0 is the normalization factor, r is the distance from cluster center, rc is the core radius (rc = 0.16 arcmin for Terzan 5; Harris 1996, 2010 edition), and q is the ratio of the masses of the X-ray sources and the stars that contribute to the core radius (q = 1.43 for Terzan 5; Heinke et al. 2006). Then we obtained that the X-ray luminosity contributed by unresolved point sources between 1 Rh (0.72 arcmin) and 4Rh (2.88 arcmin) is only about 1.4% of the unresolved X-ray luminosity within Rh . Heinke et al. (2006) estimated that the X-ray luminosity from unresolved sources within Rh is approximately 2 × 1033 erg s–1, and therefore the X-ray luminosity contributed by unresolved sources between 0.72 arcmin and 2.88 arcmin is roughly 2.8 × 1031 erg s–1, two orders of magnitude lower than the measured X-ray luminosity of the diffuse emission. Hence, the contribution from unresolved point sources can be neglected.
4.2.2 Synchrotron radiation
One possible origin of Terzan 5 diffuse X-ray emission is the nonthermal SR emission generated by relativistic elections, which radiate photons at the critical frequency νc ~ 4.2 × 10⁻⁹γ2(B/1 µG) GHz, where γ is the Lorentz factor of electrons, and B is the magnetic field strength. If the magnetic field strength is a few microgauss in the Terzan 5 field, then to generate the X- rays observed in the band of a few keV, electrons with Lorentz factors of ~108 and hence energies of E = γmec2 ~ 1014 eV, where me is the electron mass and c is the speed of light, are needed. However, high-energy electrons are depleted rapidly due to the SR cooling process, the timescale of which is given by the electron energy divided by the synchrotron energy-loss rate, dE/dt ~ 6.6 × 10⁻¹⁶γ2(B/1µG)2 eV s–1. Thus, the SR cooling timescale τSR can be estimated by τSR ~ 1013γ–1(1µG/B)2 yr, and for the few-keV X-rays in Terzan 5, τSR ~ 105 yr. Given that τSR is much smaller than the age of Terzan 5, continuous injection of such electrons is required to produce the observed diffuse emission. The large number of MSPs residing within the Rh of Terzan 5 are highly likely to be the source of those relativistic electrons (e.g., Bednarek & Sitarek 2007). On the other hand, the escape timescale of those electrons from the cluster center can be estimated using Bohm diffusion (Venter & de Jager 2008) by  , where resc is the particle propagation distance, and κBohm = cE/(3qB), where q is the particle charge. Hence, we have τesc ~ 1016γ–1(B/1 µG)(resc/1kpc)2 yr, and for the electrons from Terzan 5 center, the τesc to 1 Rh and 4 Rh are about 200 yr and 3000 yr, respectively. The inferred τesc are two to three orders of magnitude lower than the τSR, indicating that SR emission can indeed be produced in the field of Terzan 5 as observed.
However, the interesting steepening in the spectra likely implies the increasing depletion of high-energy electrons from Ring 1 to Ring 3. If the spectra steepening is indeed a result from SR cooling, like the ones observed from Crab Nebula (Mori et al. 2004) and Mouse Nebula (Klingler et al. 2018; see Reynolds et al. 2017 for a review), τSR < τesc is needed. Hence, the magnetic field strength near Terzan 5 needs to be larger than a few microgauss. For example, for B = 10 µG, τSR and τesc become 103 yr and 2 × 10³ yr (propagating to 1 Rh), respectively, and therefore the electrons are cooled before escaping beyond 1 Rh . However, the SR cooling would eventually lead to a steepening in the electron spectral index of ∆p = 1 (Pacholczyk 1970), which translates to the change of photon index of ΔΓ = 0.5. The observed change of photon indices from Ring 1 to Ring 3, however, is ΔΓ = 1.52 ± 0.73, larger than the expected value (within 2σ though). Although such a large change in photon index has also been observed from the Mouse Nebula (ΔΓ ≈ 1.4; Klingler et al. 2018), the proposed rapid SR cooling regime to produce this large variation needs an equipartition magnetic field B ~ 200 µG in the nebula, which seems to high to be plausible in a GC (e.g., the GC 47 Tuc is found to have a magnetic field of B ~ 1 µG; Abbate et al. 2023). Therefore, SR emission is unlikely to be the sole origin of the observed diffuse X-ray emission.
4.2.3 Thermal bremsstrahlung radiation
The Terzan 5 diffuse emission can also be well described by a thermal bremsstrahlung model, with the plasma temperatures and surface fluxes dropping significantly from Ring 1 to Rings 2 and 3. Moreover, from the obtained normalizations of the BREM model, we can estimate the electron/ion number densities. We supposed that ne and nI are constant with ne ≈ nI, and that the emission volume V is a sphere with the radius given by the size of the ring. Hence, the estimated ne values are 0.19±0.07 cm–3, 0.16±0.09 cm–3, and 0.10±0.08 cm–3, for Ring 1, Ring 2, and Ring 3, respectively. Interestingly, these estimated values for Terzan 5 are consistent with the ne value determined for the GC 47 Tuc (Abbate et al. 2018), making the thermal bremsstrahlung radiation physically plausible as the origin of the Terzan 5 diffuse emission. Additionally, the cooling timescale for the thermal bremsstrahlung radiation (τBREM) can be estimated by τBREM = εtot/εff, where εtot = 3(ne + nI)kT/2 is the total kinetic energy density of the plasma, and  is the total power per unit volume emitted by thermal bremsstrahlung in units of erg s−1 cm−3, where Z is the atomic number (Z = 1 for hydrogen), and
 ![Mathematical equation: ${\bar g_B} = [1.1,1.5]$](/articles/aa/full_html/2025/01/aa51217-24/aa51217-24-eq7.png) is a frequency average of the velocity averaged Gaunt factor (Rybicki & Lightman 1986). We therefore obtained
is a frequency average of the velocity averaged Gaunt factor (Rybicki & Lightman 1986). We therefore obtained  , and using the fitted values, we found τBREM ~ 108 yr for all the three rings.
Other possible origins of the Terzan 5 diffuse emission include inverse Compton emission and shocks. It is also likely that the diffuse emission may have contributions from multiple origins. Follow-up studies of the nature of the Terzan 5 diffuse X-ray emission based on our results are highly encouraged.
5 Conclusions
We investigated the diffuse X-ray emission from the field of Terzan 5 using very deep Chandra observations, including 18 observations with a total exposure time of 641.6 ks. We extracted X-ray spectra of the diffuse emission from four annular regions between 0.72 arcmin and 3.60 arcmin centered at RA=17:48:04.80, Dec=−24:46:45 (Harris 1996, 2010 edition), with an equal width of 0.72 arcmin. They were denoted Ring 1 to Ring 4, progressing from the innermost to the outermost region. By comparing the extracted spectra with their corresponding background spectra generated by the blanksky script, we found significant diffuse X-ray excess in the energy band 0.8–3 keV.
To identify the nature of the diffuse X-ray emission, we first defined the X-rays from Ring 4 as the LXB, which can be described well by a PL model with a photon index Γ = 1.44 ± 0.20. Furthermore, after removing the contribution from the LXB, we found diffuse X-ray components that are truly associated with Terzan 5 from the inner three rings. The spectral analysis shows that the Terzan 5 diffuse emission can be well fitted by a PL model, and more intriguingly, the fitted photon indices increase significantly from Γ = 1.96 ± 0.18 in Ring 1 to Γ = 3.48 ± 0.71 in Ring 3. This large variation, ΔΓ = 1.52 ± 0.73, indicates a substantial softening of the diffuse X-rays from Terzan 5 toward the outer regions. We suggest that SR is a possible origin of the observed Terzan 5 diffuse emission, though it is unlikely that the sharp steepening in the spectra is produced solely by SR cooling.
We also find that the origin of the diffuse emission could be thermal bremsstrahlung radiation, with plasma temperatures of kT = 3.11 ± 0.83 keV in Ring 1 and kT ∼ 1 keV in Rings 2 and 3. In addition, the gas densities implied by the thermal bremsstrahlung model are ∼0.1–0.2 cm−3 , consistent with the gas density measured from 47 Tuc (Abbate et al. 2018). Therefore, thermal bremsstrahlung is a possible contribution to the observed diffuse X-rays from Terzan 5. It seems likely that the diffuse X-ray emission is a result of a mix of multiple radiation processes.
We note that the softer photon index of the diffuse nonthermal X-ray component we find is likely more consistent with a low-energy SR component produced by electrons in an extended wind from the Terzan 5 pulsars, as suggested by Kopp et al. (2013), rather than requiring a separate HESR component from inside the pulsar magnetospheres, as postulated by Ndiyavala et al. (2019). Future modelings and investigations of the Terzan 5 diffuse emission based on the results in this paper will help us understand its nature.
Acknowledgements
We thank the referee’s useful and constructive comments. J.Z. is supported by China Scholarship Council (CSC), File No. 202108180023. C.H. is supported by NSERC Discovery Grant RGPIN-2023-04264. This research has made use of data obtained from the Chandra Data Archive, and software provided by the Chandra X-ray Center (CXC) in the application packages CIAO, SHERPA, DS9, and PIMMS. This research has made use of NASA’s Astrophysics Data System.
Appendix A Actual areas of spectral extractions
In Table A.1 we list the calculations of the actual areas of spectral extraction regions for the 18 Chandra observations of Terzan 5 used in this work.
Actual areas of different regions of 18 Chandra observations of Terzan 5.
References
- Abbate, F., Possenti, A., Ridolfi, A., et al. 2018, MNRAS, 481, 627 [NASA ADS] [CrossRef] [Google Scholar]
- Abbate, F., Possenti, A., Ridolfi, A., et al. 2023, MNRAS, 518, 1642 [Google Scholar]
- Abdo, A. A., Ackermann, M., Ajello, M., et al. 2009, Science, 325, 845 [NASA ADS] [CrossRef] [Google Scholar]
- Abdo, A. A., Ackermann, M., Ajello, M., et al. 2010, A&A, 524, A75 [NASA ADS] [CrossRef] [EDP Sciences] [Google Scholar]
- Altamirano, D., Keek, L., Cumming, A., et al. 2012, MNRAS, 426, 927 [CrossRef] [Google Scholar]
- Bahramian, A., & Degenaar, N. 2023, in Handbook of X-ray and Gamma-ray Astrophysics, eds. C., Bambi, & A., Santangelo (Berlin: Springer), 120 [Google Scholar]
- Bahramian, A., Heinke, C. O., Sivakoff, G. R., & Gladstone, J. C. 2013, ApJ, 766, 136 [NASA ADS] [CrossRef] [Google Scholar]
- Bahramian, A., Heinke, C. O., Sivakoff, G. R., et al. 2014, ApJ, 780, 127 [Google Scholar]
- Bahramian, A., Heinke, C. O., Degenaar, N., et al. 2015, MNRAS, 452, 3475 [NASA ADS] [CrossRef] [Google Scholar]
- Bahramian, A., Strader, J., Miller-Jones, J. C. A., et al. 2020, ApJ, 901, 57 [Google Scholar]
- Bassa, C., Pooley, D., Homer, L., et al. 2004, ApJ, 609, 755 [NASA ADS] [CrossRef] [Google Scholar]
- Bassa, C. G., Pooley, D., Verbunt, F., et al. 2008, A&A, 488, 921 [NASA ADS] [CrossRef] [EDP Sciences] [Google Scholar]
- Bednarek, W., & Sitarek, J. 2007, MNRAS, 377, 920 [NASA ADS] [CrossRef] [Google Scholar]
- Bednarek, W., & Sobczak, T. 2014, MNRAS, 445, 2842 [CrossRef] [Google Scholar]
- Bell, A. R. 1978, MNRAS, 182, 147 [Google Scholar]
- Blandford, R., & Eichler, D. 1987, Phys. Rep., 154, 1 [Google Scholar]
- Burke, D., Laurino, O., Wmclaugh, et al. 2022, https://doi.org/10.5281/zenodo.7186379 [Google Scholar]
- Cardelli, J. A., Clayton, G. C., & Mathis, J. S. 1989, ApJ, 345, 245 [Google Scholar]
- Cheng, K. S., Chernyshov, D. O., Dogiel, V. A., Hui, C. Y., & Kong, A. K. H. 2010, ApJ, 723, 1219 [NASA ADS] [CrossRef] [Google Scholar]
- Cheng, Z., Sun, X., Wang, W., & Li, Z. 2021, MNRAS, 507, 5415 [NASA ADS] [CrossRef] [Google Scholar]
- Clapson, A. C., Domainko, W., Jamrozy, M., Dyrda, M., & Eger, P. 2011, A&A, 532, A47 [NASA ADS] [CrossRef] [EDP Sciences] [Google Scholar]
- Degenaar, N., Wijnands, R., Bahramian, A., et al. 2015, MNRAS, 451, 2071 [NASA ADS] [CrossRef] [Google Scholar]
- Dempsey, R. C., Linsky, J. L., Fleming, T. A., & Schmitt, J. H. M. M. 1997, ApJ, 478, 358 [NASA ADS] [CrossRef] [Google Scholar]
- Doe, S., Nguyen, D., Stawarz, C., et al. 2007, ASP Conf. Ser., 376, 543 [NASA ADS] [Google Scholar]
- Ebisawa, K., Tsujimoto, M., Paizis, A., et al. 2005, ApJ, 635, 214 [NASA ADS] [CrossRef] [Google Scholar]
- Edmonds, P. D., Gilliland, R. L., Heinke, C. O., & Grindlay, J. E. 2003, ApJ, 596, 1177 [NASA ADS] [CrossRef] [Google Scholar]
- Eger, P., & Domainko, W. 2012, A&A, 540, A17 [NASA ADS] [CrossRef] [EDP Sciences] [Google Scholar]
- Eger, P., Domainko, W., & Clapson, A. C. 2010, A&A, 513, A66 [NASA ADS] [CrossRef] [EDP Sciences] [Google Scholar]
- Freeman, P., Doe, S., & Siemiginowska, A. 2001, SPIE Conf. Ser., 4477, 76 [NASA ADS] [Google Scholar]
- Fruscione, A., McDowell, J. C., Allen, G. E., et al. 2006, SPIE Conf. Ser., 6270, 62701V [Google Scholar]
- Grindlay, J. E., Heinke, C., Edmonds, P. D., & Murray, S. S. 2001, Science, 292, 2290 [NASA ADS] [CrossRef] [Google Scholar]
- Grindlay, J. E., Camilo, F., Heinke, C. O., et al. 2002, ApJ, 581, 470 [NASA ADS] [CrossRef] [Google Scholar]
- Guillot, S., Rutledge, R. E., Bildsten, L., et al. 2009, MNRAS, 392, 665 [NASA ADS] [CrossRef] [Google Scholar]
- H. E. S. S. Collaboration (Abramowski, A., et al.) 2011, A&A, 531, L18 [NASA ADS] [CrossRef] [EDP Sciences] [Google Scholar]
- Harris, W. E. 1996, AJ, 112, 1487 [Google Scholar]
- Heinke, C. O., Edmonds, P. D., Grindlay, J. E., et al. 2003a, ApJ, 590, 809 [NASA ADS] [CrossRef] [Google Scholar]
- Heinke, C. O., Grindlay, J. E., Edmonds, P. D., et al. 2003b, ApJ, 598, 516 [NASA ADS] [CrossRef] [Google Scholar]
- Heinke, C. O., Grindlay, J. E., Lugger, P. M., et al. 2003c, ApJ, 598, 501 [NASA ADS] [CrossRef] [Google Scholar]
- Heinke, C. O., Grindlay, J. E., Edmonds, P. D., et al. 2005, ApJ, 625, 796 [NASA ADS] [CrossRef] [Google Scholar]
- Heinke, C. O., Wijnands, R., Cohn, H. N., et al. 2006, ApJ, 651, 1098 [NASA ADS] [CrossRef] [Google Scholar]
- Heinke, C. O., Ivanov, M. G., Koch, E. W., et al. 2020, MNRAS, 492, 5684 [NASA ADS] [CrossRef] [Google Scholar]
- Hickox, R. C., & Markevitch, M. 2006, ApJ, 645, 95 [NASA ADS] [CrossRef] [Google Scholar]
- Hui, C. Y., Cheng, K. S., & Taam, R. E. 2009, ApJ, 700, 1233 [NASA ADS] [CrossRef] [Google Scholar]
- Hui, C. Y., Cheng, K. S., Wang, Y., et al. 2011, ApJ, 726, 100 [NASA ADS] [CrossRef] [Google Scholar]
- Klingler, N., Kargaltsev, O., Pavlov, G. G., et al. 2018, ApJ, 861, 5 [NASA ADS] [CrossRef] [Google Scholar]
- Kong, A. K. H., Hui, C. Y., & Cheng, K. S. 2010, ApJ, 712, L36 [NASA ADS] [CrossRef] [Google Scholar]
- Kopp, A., Venter, C., Büsching, I., & de Jager, O. C. 2013, ApJ, 779, 126 [NASA ADS] [CrossRef] [Google Scholar]
- Krockenberger, M., & Grindlay, J. E. 1995, ApJ, 451, 200 [NASA ADS] [CrossRef] [Google Scholar]
- Lorimer, D. R. 2008, Liv. Rev. Relativ., 11, 8 [NASA ADS] [CrossRef] [Google Scholar]
- Massari, D., Mucciarelli, A., Dalessandro, E., et al. 2012, ApJ, 755, L32 [NASA ADS] [CrossRef] [Google Scholar]
- Mori, K., Burrows, D. N., Hester, J. J., et al. 2004, ApJ, 609, 186 [NASA ADS] [CrossRef] [Google Scholar]
- Ndiyavala, H., Venter, C., Johnson, T. J., et al. 2019, ApJ, 880, 53 [NASA ADS] [CrossRef] [Google Scholar]
- Okada, Y., Kokubun, M., Yuasa, T., & Makishima, K. 2007, PASJ, 59, 727 [NASA ADS] [Google Scholar]
- Pacholczyk, A. G. 1970, Radio Astrophysics: Nonthermal Processes in Galactic and Extragalactic Sources (New York: W.H.Freeman & Co Ltd) [Google Scholar]
- Padmanabh, P. V., Ransom, S. M., Freire, P. C. C., et al. 2024, A&A, 686, A166 [NASA ADS] [CrossRef] [EDP Sciences] [Google Scholar]
- Pooley, D., Lewin, W. H. G., Verbunt, F., et al. 2002, ApJ, 573, 184 [NASA ADS] [CrossRef] [Google Scholar]
- Pooley, D., Lewin, W. H. G., Anderson, S. F., et al. 2003, ApJ, 591, L131 [NASA ADS] [CrossRef] [Google Scholar]
- Reynolds, S. P., Pavlov, G. G., Kargaltsev, O., et al. 2017, Space Sci. Rev., 207, 175 [NASA ADS] [CrossRef] [Google Scholar]
- Rybicki, G. B., & Lightman, A. P. 1986, Radiative Processes in Astrophysics (Hoboken: Wiley) [Google Scholar]
- Snowden, S. L., Egger, R., Freyberg, M. J., et al. 1997, ApJ, 485, 125 [Google Scholar]
- Venter, C., & de Jager, O. C. 2008, AIP Conf. Ser., 1085, 277 [NASA ADS] [CrossRef] [Google Scholar]
- Verner, D. A., Ferland, G. J., Korista, K. T., & Yakovlev, D. G. 1996, ApJ, 465, 487 [Google Scholar]
- Wilms, J., Allen, A., & McCray, R. 2000, ApJ, 542, 914 [Google Scholar]
- Wu, E. M. H., Hui, C. Y., Kong, A. K. H., et al. 2014, ApJ, 788, L40 [NASA ADS] [CrossRef] [Google Scholar]
- Yuasa, T., Nakazawa, K., & Makishima, K. 2009, PASJ, 61, 1107 [NASA ADS] [Google Scholar]
Chandra Interactive Analysis of Observations, available at https://cxc.cfa.harvard.edu/ciao/
See details on the ACIS background in the Chandra Proposers’ Observatory Guide, https://cxc.cfa.harvard.edu/proposer/POG/html/chap6.html#tth_sEc6.17, Chapter 6; and in Hickox & Markevitch (2006).
This value of NH was calculated based on the correlation between the optical extinction AV and NH (Bahramian et al. 2015), while AV was estimated using the ratio AV/E(B – V) = 3.1 (Cardelli et al. 1989), where E(B – V) = 2.28 is the foreground reddening toward Terzan 5 (Harris 1996, 2010 edition). We note that E(B – V) varies toward the field of Terzan 5 at different locations (Massari et al. 2012), but the value used here appears to reasonably match the reddening observed in the cluster regions we studied.
All Tables
All Figures
|
Fig. 1 Chandra X-ray images of Terzan 5. Left: exposure-corrected, combined Chandra X-ray image of Terzan 5 in the band 0.5–7 keV. The small and large green circles show the half-light radius (0.72 arcmin) and five times the half-light radius (3.60 arcmin), respectively, centered at RA=17:48:04.80, Dec=−24:46:45 (Harris 1996, 2010 edition). Right: region of interest and the spectral extraction regions of observation 3798 for an example. See the region definitions in Sect. 2.4. The outer square shows the FoV of the observation, while the regions of the four annuli within the FoV (ring numbers annotated) show the spectral extraction areas. Ring 4 was used to extract the Terzan 5 background and is marked with a dashed circle. The X-ray image is generated in the band 0.5–7 keV with smoothed 0.492-arcsecond pixels. North is up, and east is to the left. |
| In the text | |
|
Fig. 2 X-ray spectra of four rings and their combination from ObsID 15615 of the Terzan 5 field, in the energy band 0.3–12 keV. The observed spectra (un-subtracted) are shown as colored dots, while the background spectra extracted from corresponding blank-sky files are shown as crosses, with photons grouped into 50 counts per bin. Shaded regions indicate where the observed and background spectra are almost indistinguishable. The spectra of each ring are scaled to provide adequate spacing for display purposes. |
| In the text | |
|
Fig. 3 Spectrum and the best fit of the diffuse X-ray emission (0.8–3 keV) extracted from Ring 4 of Terzan 5 from ObsID 15615 (see Sect. 2.4 fo2r the ring definition). The best-fit model is given by agle absorbed PL. Data are grouped into at least 50 photons per bin. |
| In the text | |
|
Fig. 4 Spectra and best fits of the diffuse X-ray emission (0.8–3 keV) extracted from the inner three rings of Terzan 5 from ObsID 15615. The dotted line and the dashed line show the X-ray components of the LXB and Terzan 5, fitted with absorbed PL models with independent NH values, respectively. The ring number is annotated in the upper-left corner. Data are grouped into at least 50 photons per bin. |
| In the text | |
|
Fig. 5 Change in the unabsorbed surface flux (upper panel) and the photon index (lower panel) of the diffuse X-ray emission from Terzan 5 as a function of distance from the center of Terzan 5. The horizontal error bars show the spatial extent of the rings, and the vertical error bars show 1σ uncertainties. The unabsorbed surface flux of the LXB (subtracted from the Terzan 5 flux measurements shown) is also shown in the upper panel (dotted line with 1σ shaded region), which is assumed to be constant toward the Terzan 5 field. |
| In the text | |
Current usage metrics show cumulative count of Article Views (full-text article views including HTML views, PDF and ePub downloads, according to the available data) and Abstracts Views on Vision4Press platform.
Data correspond to usage on the plateform after 2015. The current usage metrics is available 48-96 hours after online publication and is updated daily on week days.
Initial download of the metrics may take a while.