Fig. 4.
Download original image
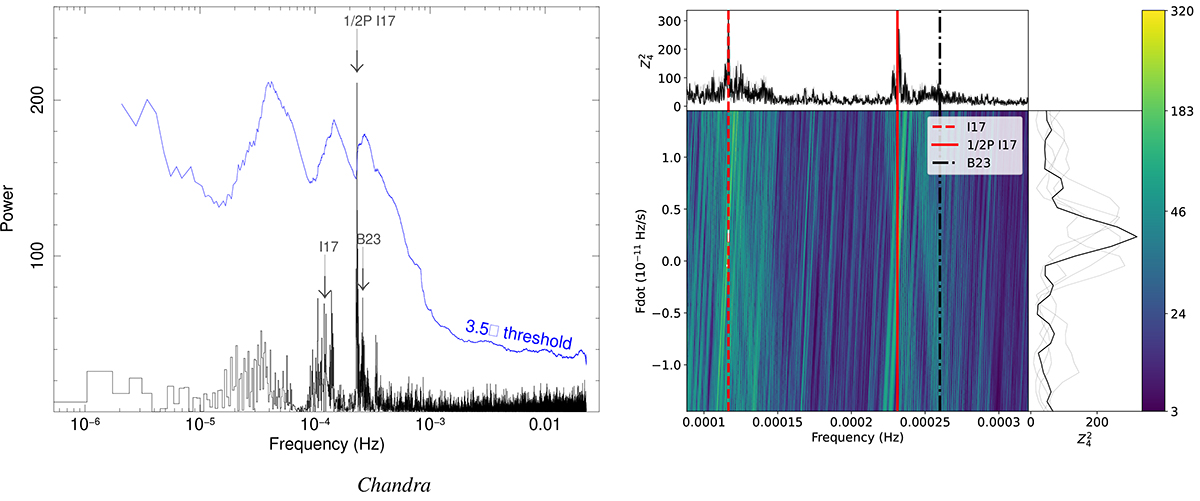
Results of the pulsation searches in Chandra data of W2. Left panel: power density spectrum (PDS) in the 0.2−10 keV energy range by using the 2002 datasets 2735–8 and one single interval. The 3.5σ detection threshold is also shown and marked by the blue solid line. The PDS is complex and only one peak is above the threshold, corresponding to the harmonic of the 8649 s period (both the fundamental and the harmonic are marked by I17 and 1/2P I17, respectively). The period suggested by Bao et al. (2023) is indicated as B23. Right: ![]() search with N = 4 harmonics of ObsIDs. 2735–8. The fundamental and the first harmonic of the period at P ≃ 8650 s are marked with red dashed and solid lines, respectively, while the period proposed by Bao et al. (2023) is marked with a black dash-dotted line.
search with N = 4 harmonics of ObsIDs. 2735–8. The fundamental and the first harmonic of the period at P ≃ 8650 s are marked with red dashed and solid lines, respectively, while the period proposed by Bao et al. (2023) is marked with a black dash-dotted line.
Current usage metrics show cumulative count of Article Views (full-text article views including HTML views, PDF and ePub downloads, according to the available data) and Abstracts Views on Vision4Press platform.
Data correspond to usage on the plateform after 2015. The current usage metrics is available 48-96 hours after online publication and is updated daily on week days.
Initial download of the metrics may take a while.