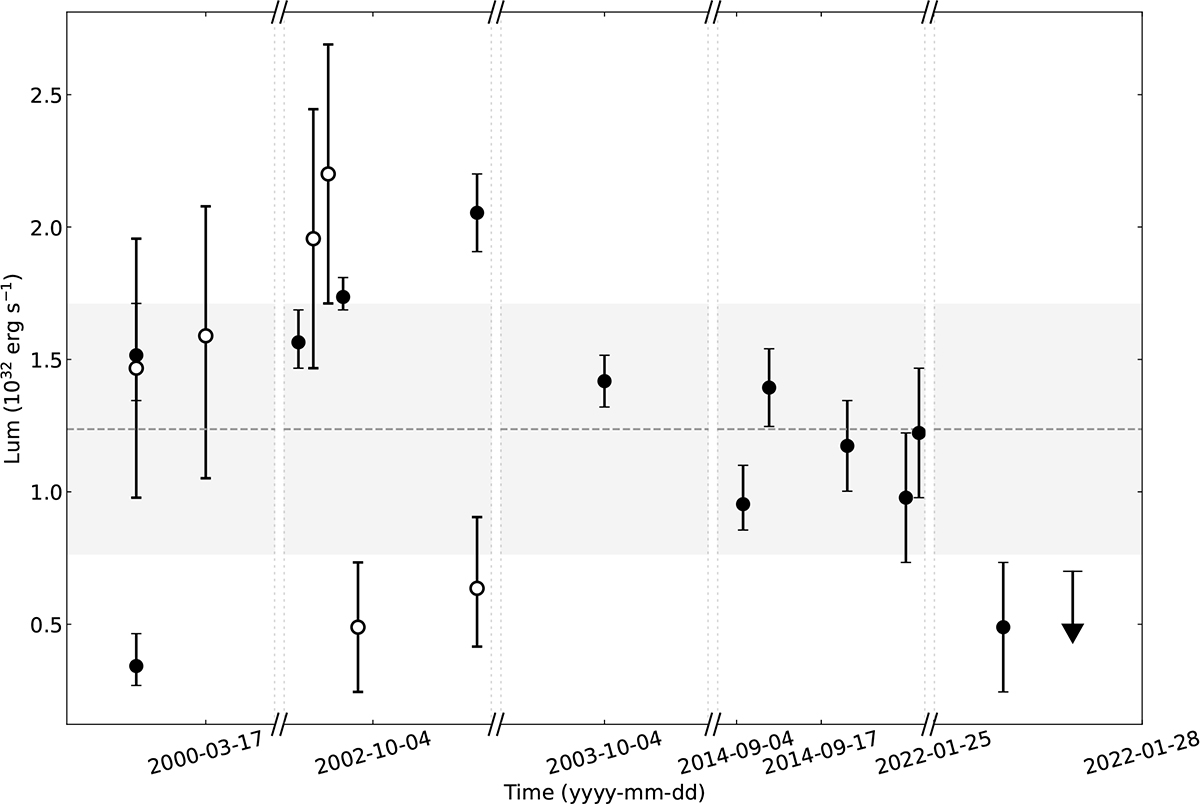
Fig. 3.
Download original image
Light curve of W2. Empty data points are for those observations with exposures shorter than the orbital period; the black arrow represents the upper limit at 90% c.l. on the luminosity of the latest Chandra observation (ObsID. 26286); the grey dotted line and area represents the average luminosity of the source and its uncertainty at 90 % c.l., respectively.
Current usage metrics show cumulative count of Article Views (full-text article views including HTML views, PDF and ePub downloads, according to the available data) and Abstracts Views on Vision4Press platform.
Data correspond to usage on the plateform after 2015. The current usage metrics is available 48-96 hours after online publication and is updated daily on week days.
Initial download of the metrics may take a while.