Fig. 9
Download original image
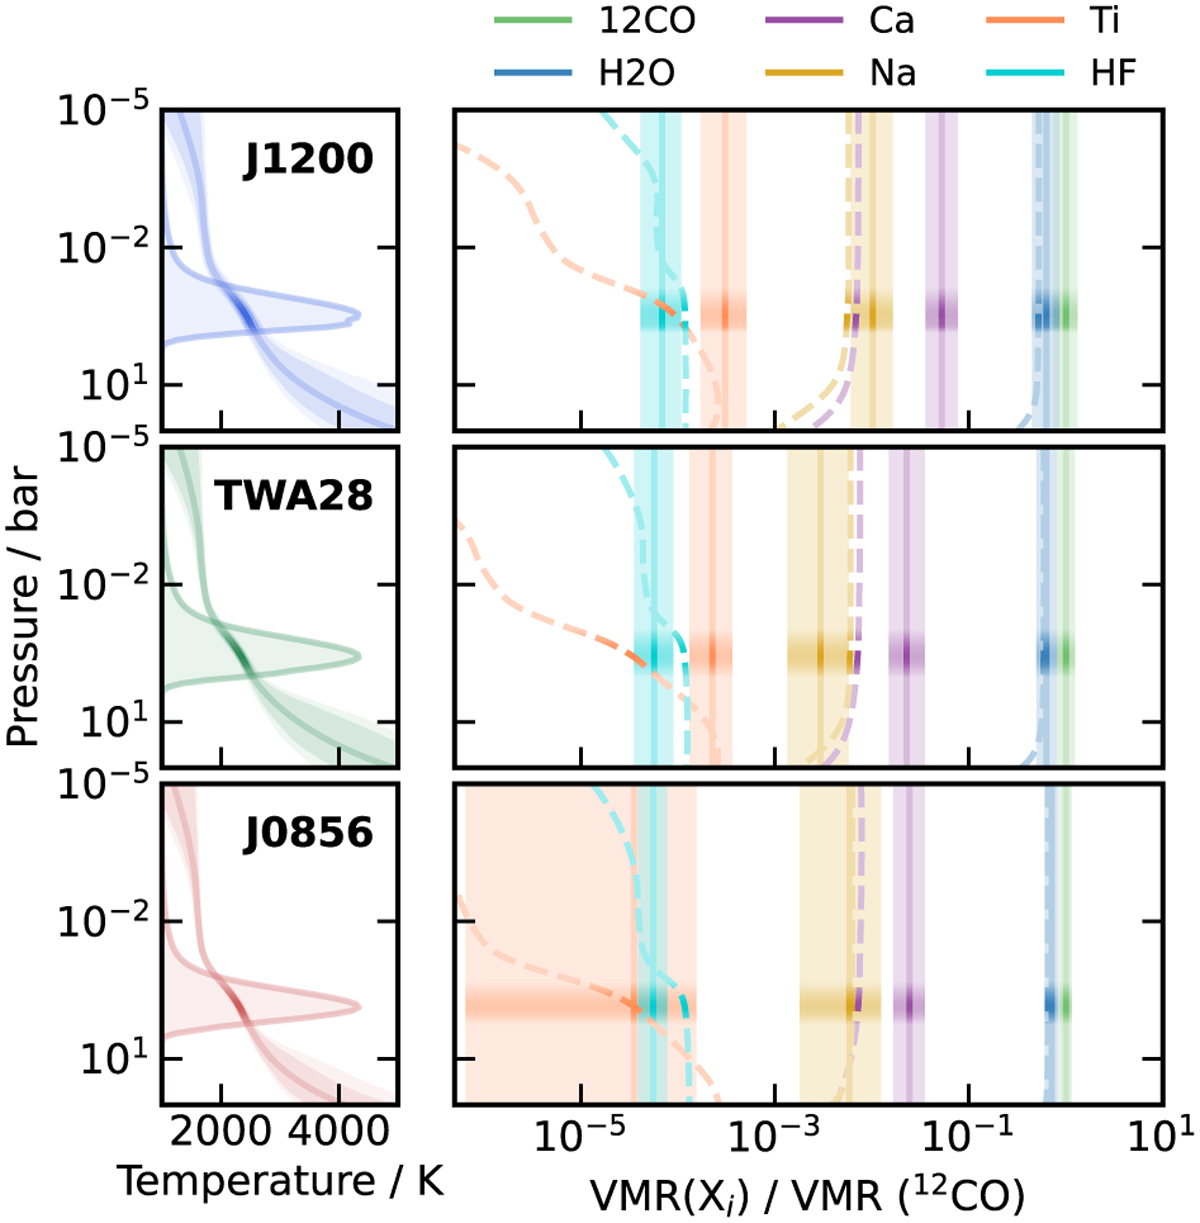
Retrieved VMRs of line species compared to EC values of the retrieved temperature profiles of each target. The dashed lines indicate the values from EC at the retrieved C/O and metallicity. The shaded regions represent the retrieved 1σ confidence region around the best fit. The integrated contribution function is plotted in the left column and indicated in the right column as a dark shaded region.
Current usage metrics show cumulative count of Article Views (full-text article views including HTML views, PDF and ePub downloads, according to the available data) and Abstracts Views on Vision4Press platform.
Data correspond to usage on the plateform after 2015. The current usage metrics is available 48-96 hours after online publication and is updated daily on week days.
Initial download of the metrics may take a while.