Open Access
Fig. 5
Download original image
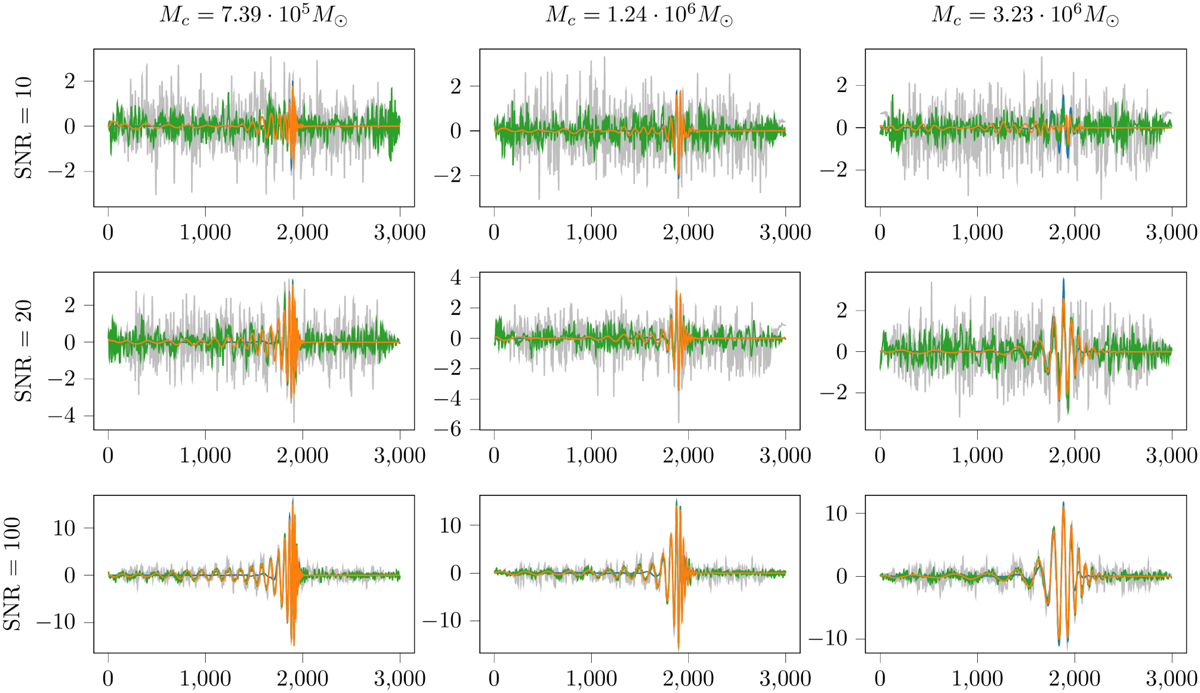
Reconstructed signals for the different methods at multiple chirp masses and S/N. The gray signal corresponds to the noisy input, the blue one to PCA reconstruction, the green one to wavelet reconstruction, and the orange one to the IAE reconstruction.
Current usage metrics show cumulative count of Article Views (full-text article views including HTML views, PDF and ePub downloads, according to the available data) and Abstracts Views on Vision4Press platform.
Data correspond to usage on the plateform after 2015. The current usage metrics is available 48-96 hours after online publication and is updated daily on week days.
Initial download of the metrics may take a while.