Fig. 3.
Download original image
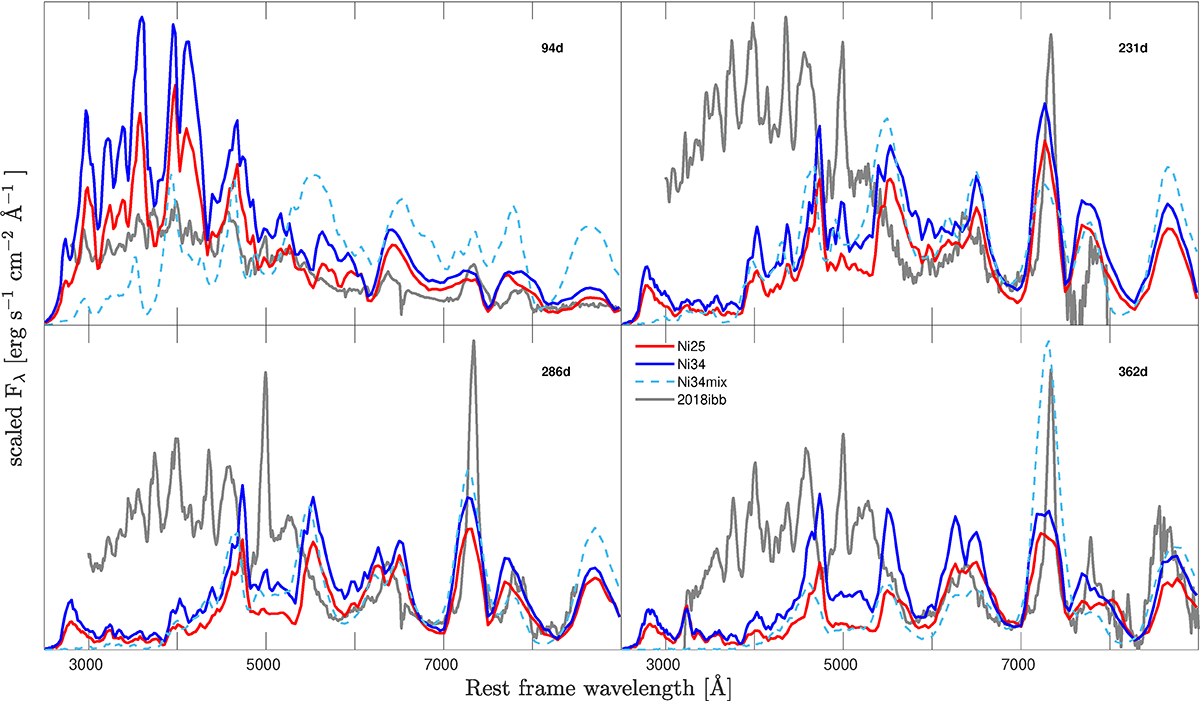
Spectral series of synthetic spectra with observational data superimposed. Red, blue, and cyan curves represent the P250Ni25, P250Ni34, and P250Ni34mix models, respectively. The observed spectra (shown in grey) are different from those published in Schulze et al. (2024) because we plotted spectra corrected for galactic extinction and the host (S. Schulze, private communication). Days are since the g and r maximum in the rest frame. Spectra are calibrated to the maximum flux values in each subplot. A rise time of 120 days is assumed for the P250Ni34 and P250Ni25 models, and 100 days for P250Ni34mix.
Current usage metrics show cumulative count of Article Views (full-text article views including HTML views, PDF and ePub downloads, according to the available data) and Abstracts Views on Vision4Press platform.
Data correspond to usage on the plateform after 2015. The current usage metrics is available 48-96 hours after online publication and is updated daily on week days.
Initial download of the metrics may take a while.