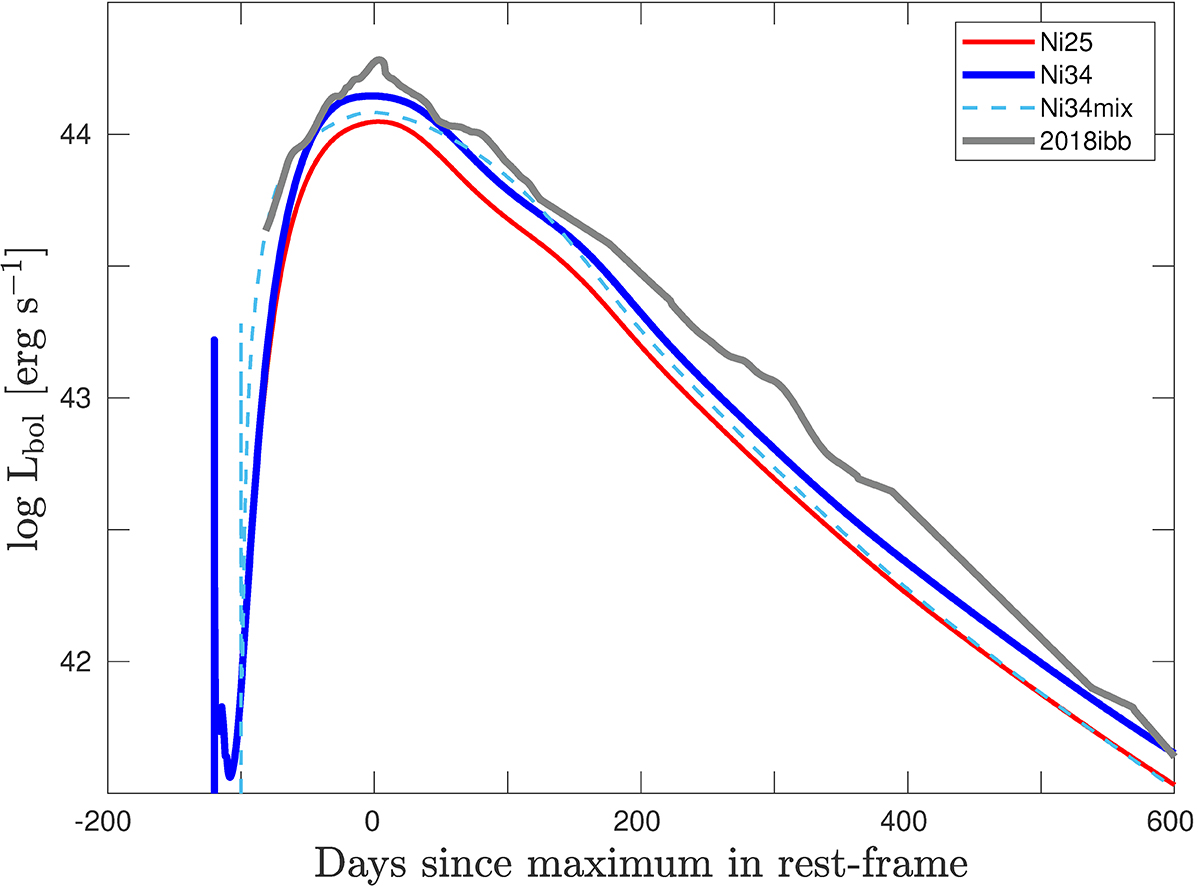
Fig. 1.
Download original image
Bolometric light curves for the models P250Ni25 (red curve, labelled ‘Ni25’), P250Ni34 (blue curve, labelled ‘Ni34’), and P250Ni34mix (cyan curve, labelled ‘Ni34mix’), and the bolometric light curve for SLSN 2018ibb (grey curve, labelled ‘2018ibb’) taken from Schulze et al. (2024). Time ‘0’ corresponds to the peak in g and r-band magnitude, similar to the tmax in Schulze et al. (2024).
Current usage metrics show cumulative count of Article Views (full-text article views including HTML views, PDF and ePub downloads, according to the available data) and Abstracts Views on Vision4Press platform.
Data correspond to usage on the plateform after 2015. The current usage metrics is available 48-96 hours after online publication and is updated daily on week days.
Initial download of the metrics may take a while.