Fig. 9
Download original image
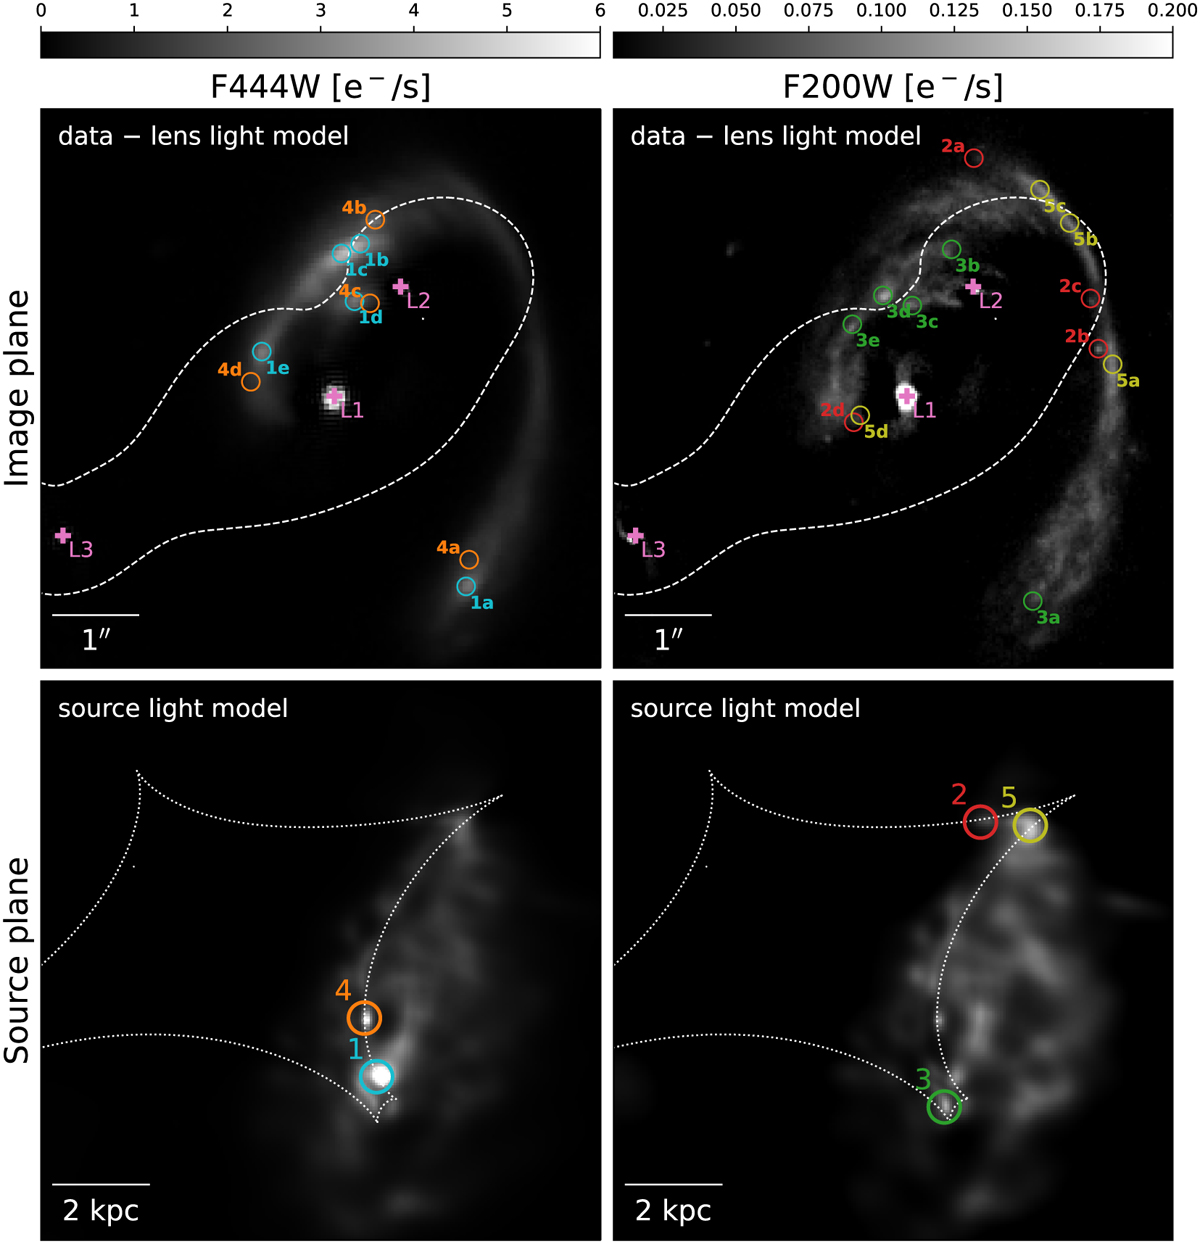
Multiple images of peculiar features in the background source galaxy. Top row: families of multiple images in image plane together with the critical lines and the observed flux from the arc (after lens subtraction in filters F444W ad F200W). Also shown are the positions of the three deflectors with pink crosses (residuals remaining after lens light subtraction are visible around L1 and L2 positions), as well as the critical lines with dashed white lines. Our model also predicts images at the position of L1 and L2, although there are not shown here to limit clutter. Bottom row: corresponding image positions on the source plane, superimposed onto one sample of our source model. The tangential caustic is shown with dotted white lines. Note that each column has its own dynamic range. Scale bars indicate the angular (in arcsec) and physical (in kpc) scales in image and source plane (assuming zs = 2.291), respectively.
Current usage metrics show cumulative count of Article Views (full-text article views including HTML views, PDF and ePub downloads, according to the available data) and Abstracts Views on Vision4Press platform.
Data correspond to usage on the plateform after 2015. The current usage metrics is available 48-96 hours after online publication and is updated daily on week days.
Initial download of the metrics may take a while.