Fig. 8
Download original image
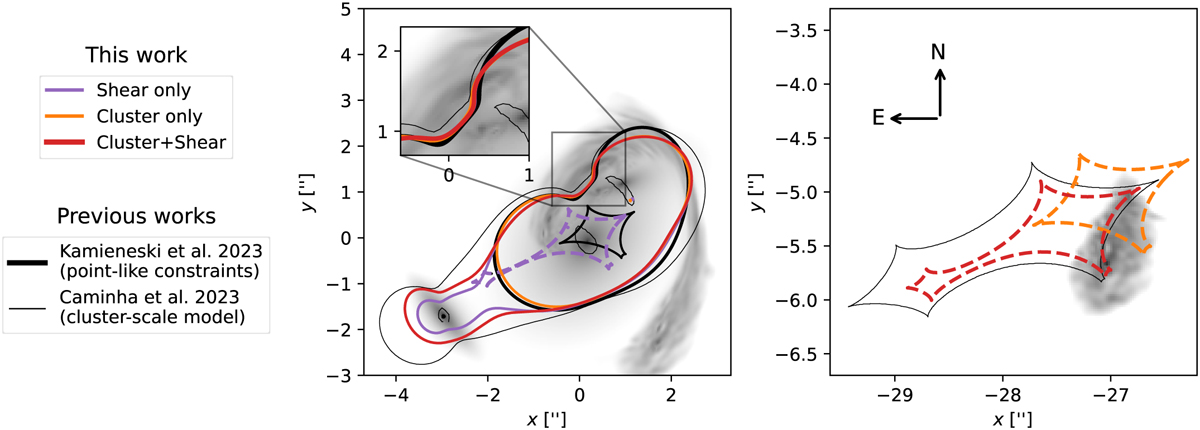
Critical curves and caustics predicted by the different lens models explored in this work, namely “Shear only”, “Cluster only” and our fiducial model “Cluster+Shear” that best fits the data. Also shown are the critical lines and caustics from recent models of El Anzuelo, namely from Kamieneski et al. (2023, constrained by pairs of multiple images with JWST imaging data) and Caminha et al. (2023, cluster-scale model of El Gordo using HST and MUSE data sets). Caustics from our models are shown with dashed lines for clarity. The left panel is focused on the image plane, while the right panel is focused on the source region predicted by models including the cluster mass distribution. Note how the position of the caustics for models that do not include the cluster contribution (i.e., the Kamieneski et al. 2023 and “Shear only” models) is aligned with the lens (left panel), compared to the caustics of other models (right panel). The predicted (unlensed) surface brightness of the lens and source galaxies from the best-fit “Cluster+Shear” model (red curves) is shown in the background. North and East directions are indicated by the arrows.
Current usage metrics show cumulative count of Article Views (full-text article views including HTML views, PDF and ePub downloads, according to the available data) and Abstracts Views on Vision4Press platform.
Data correspond to usage on the plateform after 2015. The current usage metrics is available 48-96 hours after online publication and is updated daily on week days.
Initial download of the metrics may take a while.