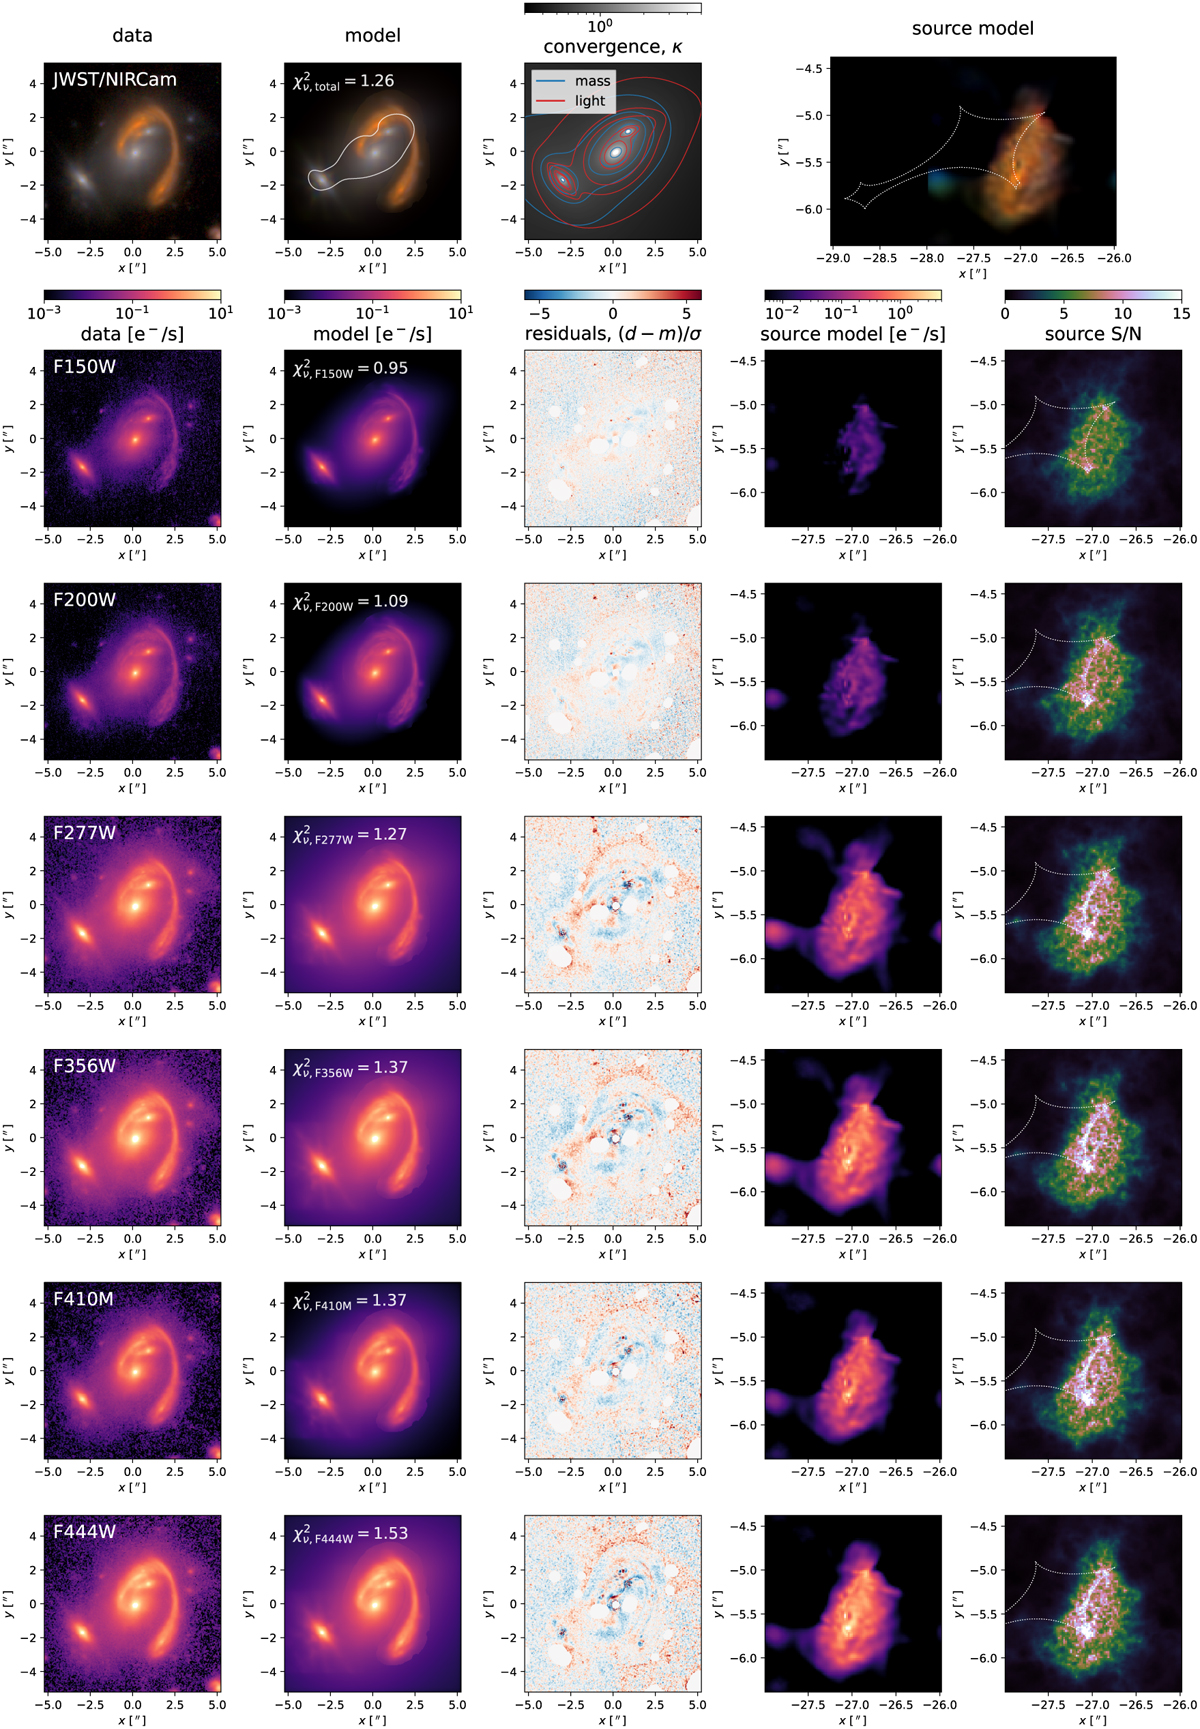
Fig. 7
Download original image
Mean lens model among the best-fit posterior samples for our fiducial “Cluster+Shear” model. First row, from left to right: color image of the data, color image of the model with reduced χ2 from image residuals (which differs from the full log-likelihood, see Eq. (3)), convergence map (with convergence and surface brightness contours), and color image of the unlensed source model. Remaining rows, from left to right: data in the indicated filter, model, normalized residuals (areas excluded from the fit appear white), unlensed source model, S/N source map defined as the mean source model divided by the standard deviation of the model posterior in each source pixel. Critical lines and caustics are indicated in some of the panels as white solid line in the image model panel, and dotted lines in the right column panels. The source S/N is higher within and along the caustics, since image multiplicity and lensing magnification are higher, respectively.
Current usage metrics show cumulative count of Article Views (full-text article views including HTML views, PDF and ePub downloads, according to the available data) and Abstracts Views on Vision4Press platform.
Data correspond to usage on the plateform after 2015. The current usage metrics is available 48-96 hours after online publication and is updated daily on week days.
Initial download of the metrics may take a while.