Fig. 2
Download original image
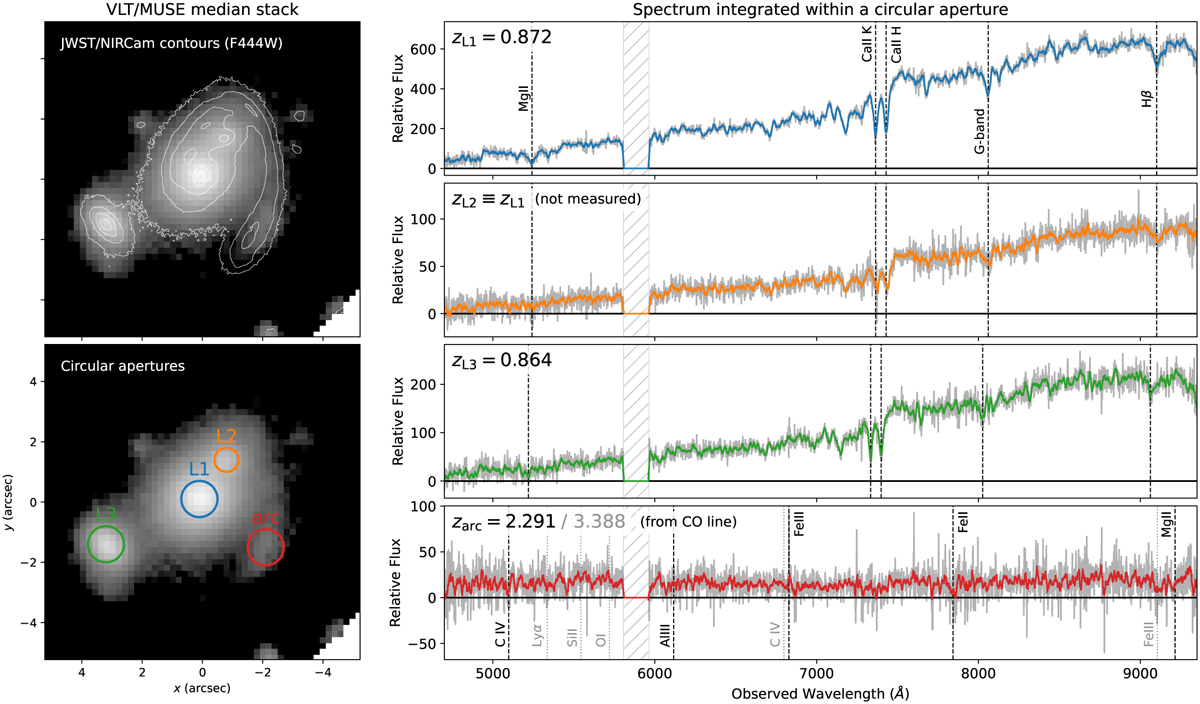
Extraction of MUSE aperture spectra within circular apertures, for L1, L2, L3 and the western part of E1 Anzuelo arc. Top left panel: luminosity-weighted median stack of the MUSE datacube, with contours from NIRCam/F444W observations. Bottom left panel: MUSE median stack with circular apartures used to extract spectra. Circular apertures have a radius of 0″.6 for L1, L3 and the arc, and 0″.3 for L2. Right panels: corresponding ID spectra (in gray) in the observed frame, with absorptions lines indicated, as well as smoothed spectra (in color). The hatched region indicates the gap caused to laser guiding. The estimated redshift of each component is also indicated in the upper left corner. We measure the redshifts for L1 and L3, but assume that L2 is at the same redshift as L1 and that the source is at redshift z = 2.291 (Kamieneski et al. 2023, using a CO line detection in ALMA observations). Some key absorption lines are indicated by thin dashed gray lines (line labels are indicated in top and bottom panels only to avoid clutter). For the arc, we indicate two sets of lines corresponding to our assumed redshift (black and dashed lines) and the alternative possible redshift z = 3.388 (gray and dotted lines, for details see Kamieneski et al. 2023). In this work we only use L1 and L3 spectra to extract their stellar kinematics measurements, as L2 is highly blended with L1 and the signal from the arc is too faint.
Current usage metrics show cumulative count of Article Views (full-text article views including HTML views, PDF and ePub downloads, according to the available data) and Abstracts Views on Vision4Press platform.
Data correspond to usage on the plateform after 2015. The current usage metrics is available 48-96 hours after online publication and is updated daily on week days.
Initial download of the metrics may take a while.