Fig. D.1
Download original image
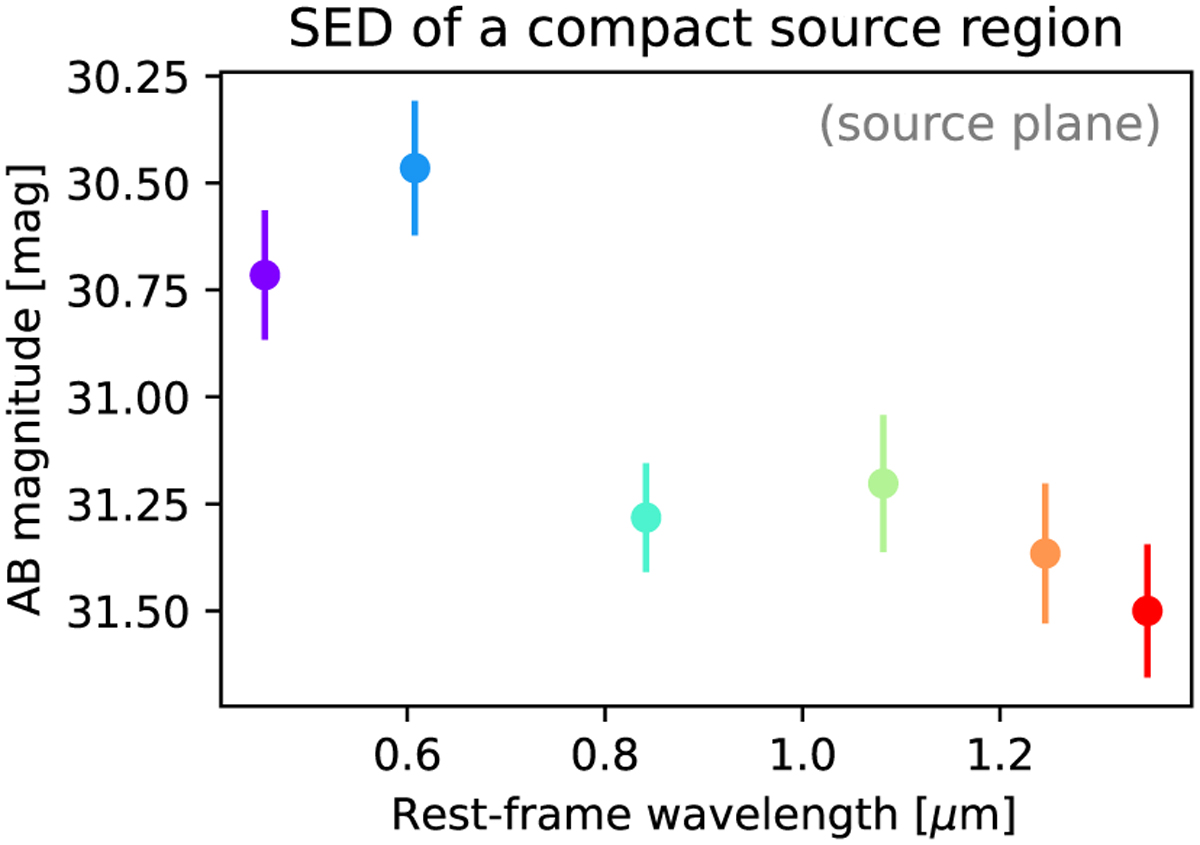
Spectral energy distribution of image 2b shown in the top right panel of Fig. 9, from the six JWST/NIRCam filters considered in this work. The x axis shows rest-frame wavelength assuming a source red-shift of zs = 2.291 and the y axis shows de-magnified AB magnitudes, integrated within a circular aperture of radius 0″.2, after subtraction of both the lens and source light models.
Current usage metrics show cumulative count of Article Views (full-text article views including HTML views, PDF and ePub downloads, according to the available data) and Abstracts Views on Vision4Press platform.
Data correspond to usage on the plateform after 2015. The current usage metrics is available 48-96 hours after online publication and is updated daily on week days.
Initial download of the metrics may take a while.