Fig. 12
Download original image
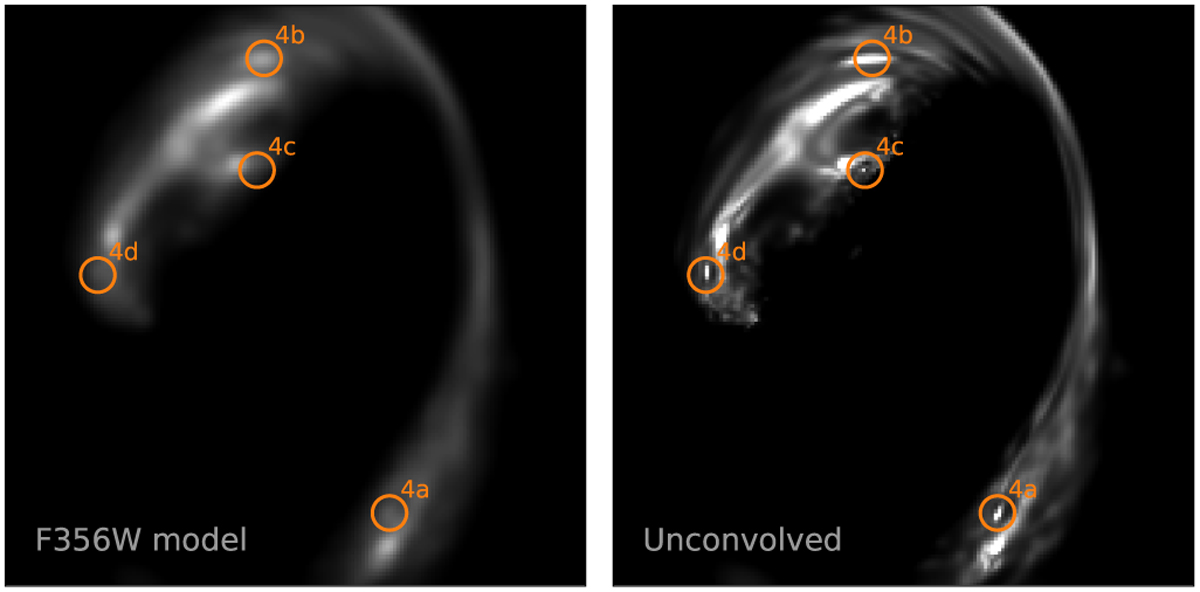
Multiple images of a ≲ 400 pc compact clump in the source galaxy (image 4 in Fig. 9 and shown in color in Fig. ). Only image 4a is clearly visible in the data and our model, shown in the left panel (shown here for filter F356W, which also looks similar in F277W, F410M and F444W filters that are not shown). The right panel shows for comparison the model before convolution by the PSF, which reveals the four multiple images (the colormap slightly saturates the brighter pixels to improve contrast).
Current usage metrics show cumulative count of Article Views (full-text article views including HTML views, PDF and ePub downloads, according to the available data) and Abstracts Views on Vision4Press platform.
Data correspond to usage on the plateform after 2015. The current usage metrics is available 48-96 hours after online publication and is updated daily on week days.
Initial download of the metrics may take a while.