Fig. 11
Download original image
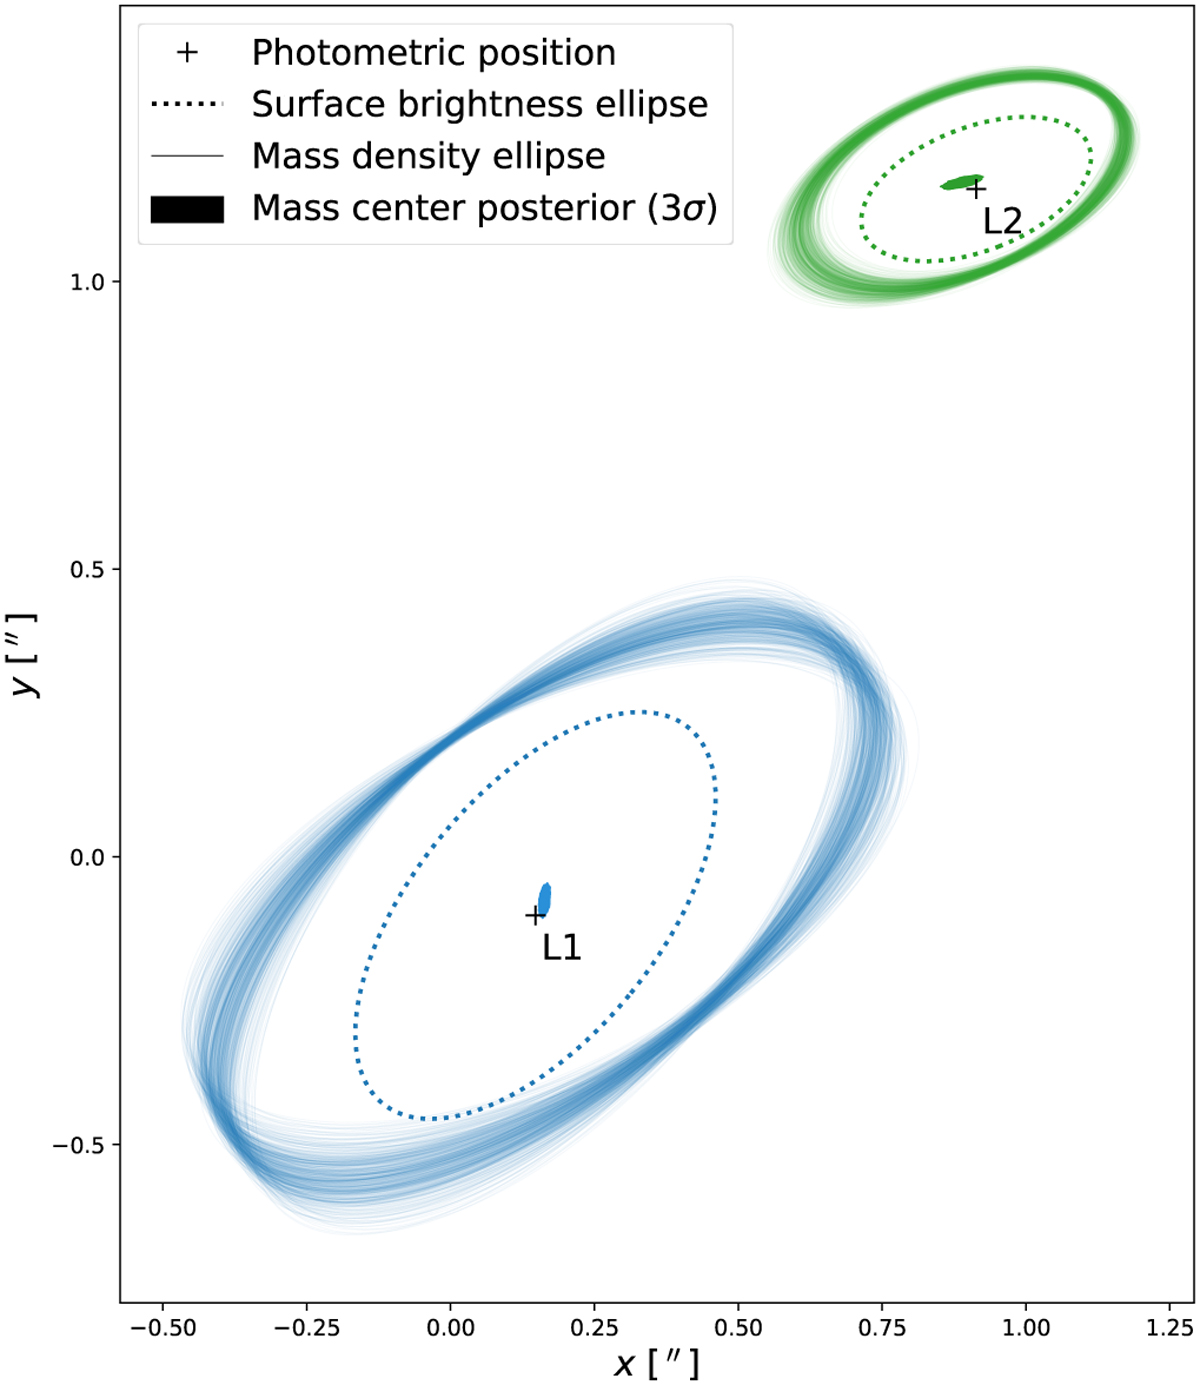
Visualization of position, ellipticity and angular size of the deflectors L1 and L2. For each galaxy, the cross shows the mean position across the six bands from the fit to the surface brightness (double-Sérsic profile), and the dotted line shows an ellipse to visualize that fit whose radius corresponds to the half-light radius of the profile. The sets of thin lines are ellipses corresponding to 500 individual samples of the lens-ing convergence (EPL profile) with radius equal to the Einstein radius, drawn from the posterior distribution of Fig. 10. Close to the position of each deflector, small shaded contours indicate the posterior distribution of the EPL center (extending to 3σ). For each deflectors, we see offsets in position angle and centroids between their mass and light distributions.
Current usage metrics show cumulative count of Article Views (full-text article views including HTML views, PDF and ePub downloads, according to the available data) and Abstracts Views on Vision4Press platform.
Data correspond to usage on the plateform after 2015. The current usage metrics is available 48-96 hours after online publication and is updated daily on week days.
Initial download of the metrics may take a while.