Fig. 6
Download original image
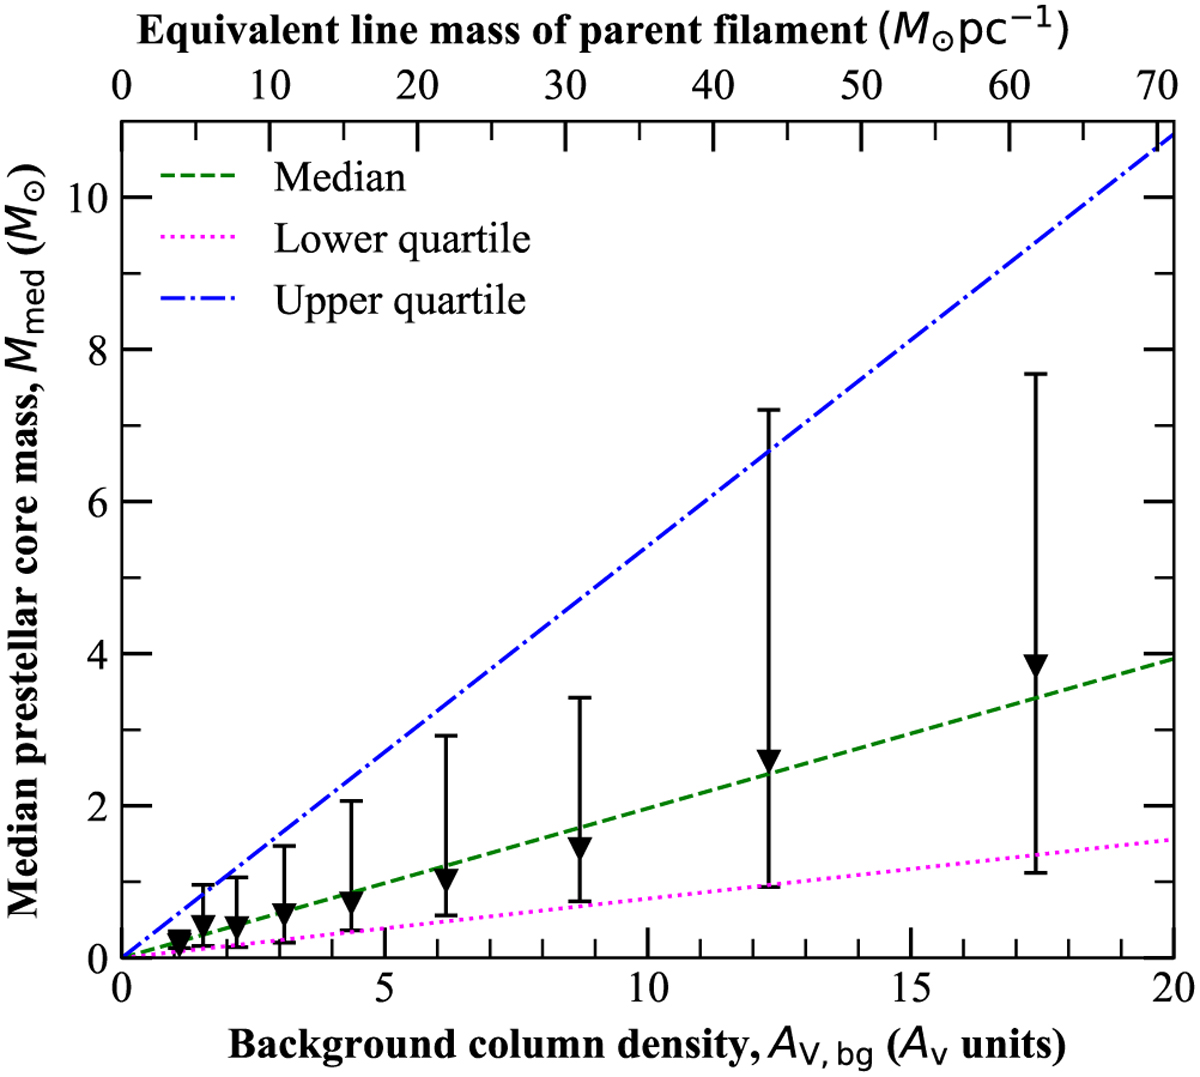
Median candidate prestellar core mass plotted against background cloud column density (AV units) is shown by the black triangles. The error bars represent the inter-quartile range of observed masses within each bin. The green dashed line depicts a linear fit to the median masses as a function of AV,bg, given by Mmed ∝ (0.2 ± 0.02) × AV,bg. The blue dash-dotted line corresponds to a linear fit to the upper quartiles of median observed masses, while the magenta dotted line represents a linear fit to the lower quartiles.
Current usage metrics show cumulative count of Article Views (full-text article views including HTML views, PDF and ePub downloads, according to the available data) and Abstracts Views on Vision4Press platform.
Data correspond to usage on the plateform after 2015. The current usage metrics is available 48-96 hours after online publication and is updated daily on week days.
Initial download of the metrics may take a while.