Fig. A.1
Download original image
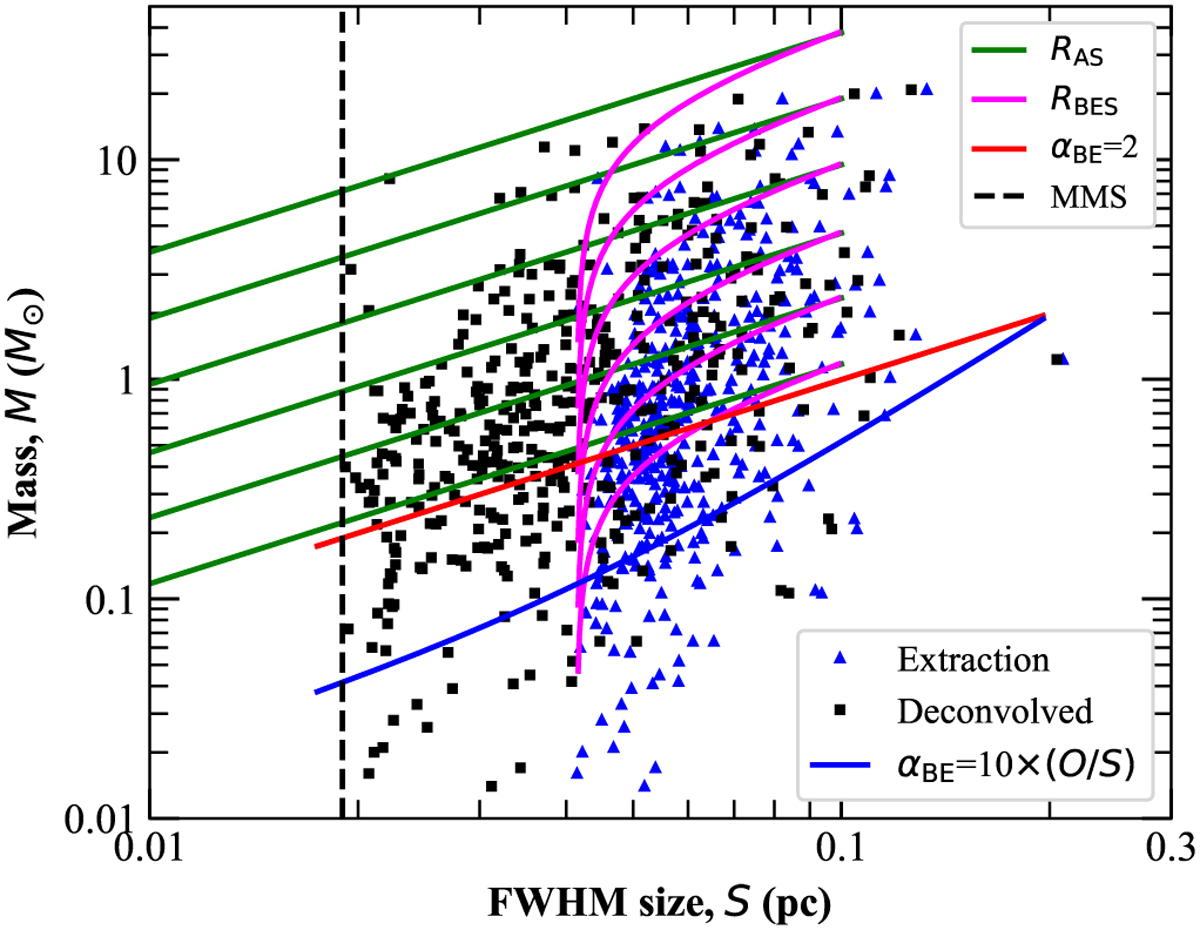
Mass–size diagram of the cores detected in the simulated Herschel images. The red line represents half of the critical Bonnor-Ebert mass (MBE/2) at 10 K as a function of radius. The blue line shows the empirical threshold used to select candidate prestellar cores in Sect. 3.2 (cf. Fig. 4), which captures 95% of the synthetic prestellar cores in the simulation. The curves labeled RBES (in magenta) show the mass vs. radius relations for the convolved model cores, while the lines labeled RAS (in green) represent the true mass vs. radius relations of the models. The black dashed vertical line shows the minimum derived model size (MMS) used when applying simple Gaussian deconvolution to the simulated extraction results (see Sect. 3.2).
Current usage metrics show cumulative count of Article Views (full-text article views including HTML views, PDF and ePub downloads, according to the available data) and Abstracts Views on Vision4Press platform.
Data correspond to usage on the plateform after 2015. The current usage metrics is available 48-96 hours after online publication and is updated daily on week days.
Initial download of the metrics may take a while.