Fig. 4
Download original image
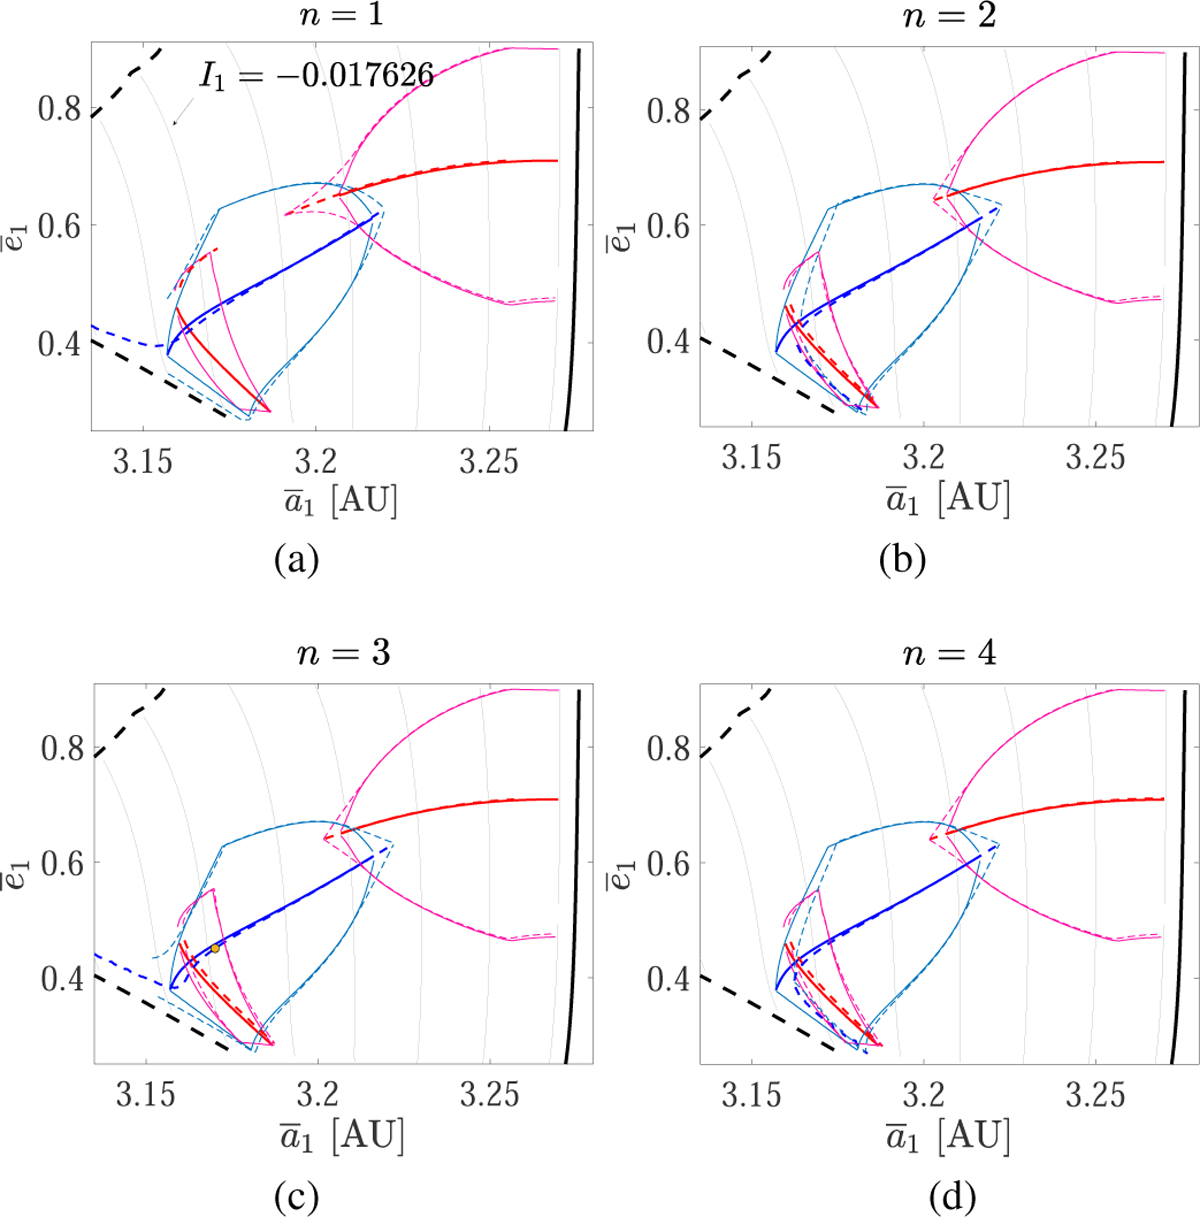
Locations of v¡ resonance centers and the corresponding boundaries of the libration domain of the partial normal form ![]() with n = 0,1,…, 4. The resonance center at ψ2 = 0 (ψ2 = π) of the ideal resonance model
with n = 0,1,…, 4. The resonance center at ψ2 = 0 (ψ2 = π) of the ideal resonance model ![]() is presented as a solid red (blue) curve in each frame. The boundaries of the libration domains that embrace the curves of center at Ψ2 = 0 (Ψ2 = π) are presented as pink (light blue) curves. The resonance structures of the partial normal form
is presented as a solid red (blue) curve in each frame. The boundaries of the libration domains that embrace the curves of center at Ψ2 = 0 (Ψ2 = π) are presented as pink (light blue) curves. The resonance structures of the partial normal form ![]() with n = 1,…, 4 are presented as dashed curves in frames a-d. The vertical gray curves are level curves of I1, which approximates the level curves of J1, along which the v5 libration follows. In frame c, the yellow dot marks the pseudo-proper elements of the flow of
with n = 1,…, 4 are presented as dashed curves in frames a-d. The vertical gray curves are level curves of I1, which approximates the level curves of J1, along which the v5 libration follows. In frame c, the yellow dot marks the pseudo-proper elements of the flow of ![]() in frame c of Fig. E.1.
in frame c of Fig. E.1.
Current usage metrics show cumulative count of Article Views (full-text article views including HTML views, PDF and ePub downloads, according to the available data) and Abstracts Views on Vision4Press platform.
Data correspond to usage on the plateform after 2015. The current usage metrics is available 48-96 hours after online publication and is updated daily on week days.
Initial download of the metrics may take a while.