Fig. B.3
Download original image
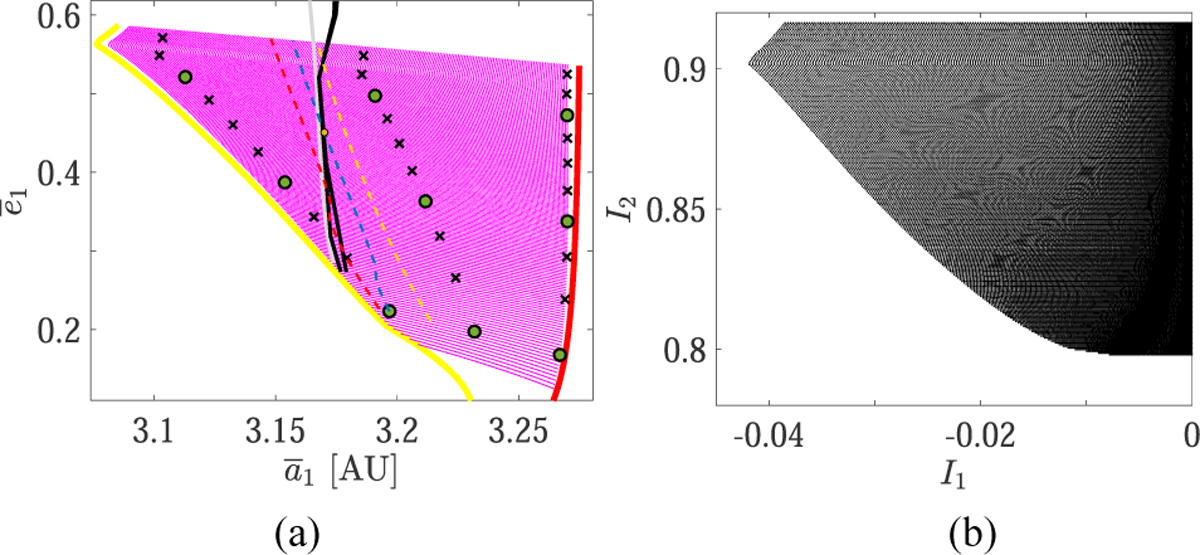
Frame (a): Projection of the grid 𝒢2 onto the ![]() plane (pink crosses), which is the work domain for the computation of the action variable of
plane (pink crosses), which is the work domain for the computation of the action variable of ![]() . Red and yellow curves are taken from Fig. B.1. The gray curve is the level curve of I1 = −0.017626 in Fig. 4(a). The two black curves mark approximately the boundaries where the black crosses have corresponding circles dwelling exactly on them in Fig. 5. The red, blue, and yellow curves are the level curve of σL = 5 × 10−6,4 × 10−6, 3 × 10⁻⁶. The yellow dot is taken from Fig. 4(c). Frame (b): Grid 𝒢3 defined in Eq. (B.10) marked by black crosses.
. Red and yellow curves are taken from Fig. B.1. The gray curve is the level curve of I1 = −0.017626 in Fig. 4(a). The two black curves mark approximately the boundaries where the black crosses have corresponding circles dwelling exactly on them in Fig. 5. The red, blue, and yellow curves are the level curve of σL = 5 × 10−6,4 × 10−6, 3 × 10⁻⁶. The yellow dot is taken from Fig. 4(c). Frame (b): Grid 𝒢3 defined in Eq. (B.10) marked by black crosses.
Current usage metrics show cumulative count of Article Views (full-text article views including HTML views, PDF and ePub downloads, according to the available data) and Abstracts Views on Vision4Press platform.
Data correspond to usage on the plateform after 2015. The current usage metrics is available 48-96 hours after online publication and is updated daily on week days.
Initial download of the metrics may take a while.