Fig. B.1
Download original image
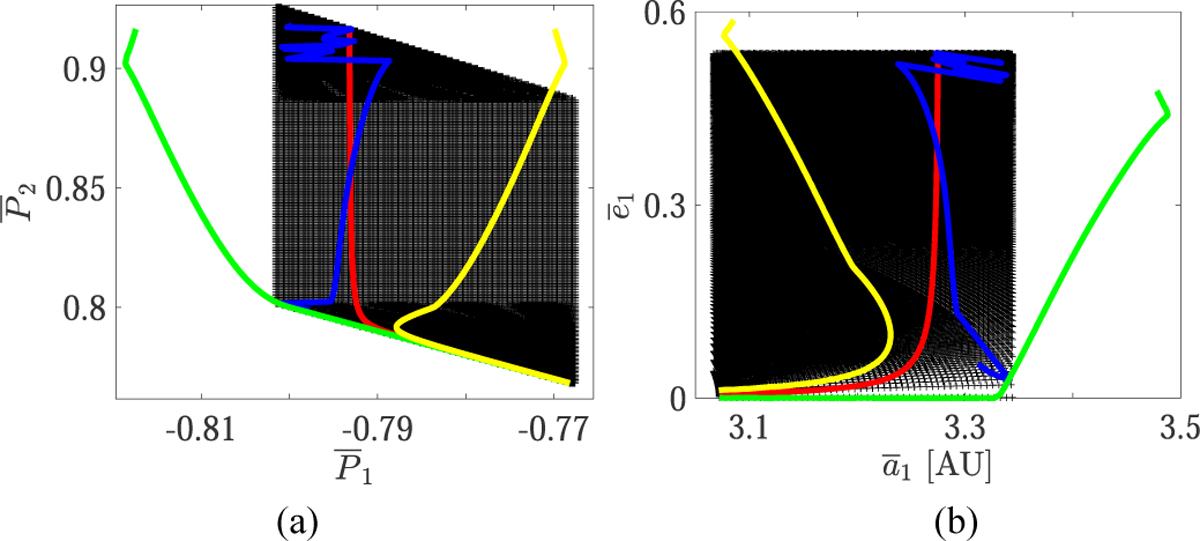
Left frame: Grid 𝒢1 marked by black crosses, which is the work domain for the integrable approximation ![]() . Red (blue) curve marks the location of resonance center (saddle) at
. Red (blue) curve marks the location of resonance center (saddle) at ![]() . Green and yellow curves are the libration boundaries for centers at
. Green and yellow curves are the libration boundaries for centers at ![]() . Right frame: Projection of the grid 𝒢1 as well as the resonance equilibriums and libration boundaries onto the a1 − β1 plane.
. Right frame: Projection of the grid 𝒢1 as well as the resonance equilibriums and libration boundaries onto the a1 − β1 plane.
Current usage metrics show cumulative count of Article Views (full-text article views including HTML views, PDF and ePub downloads, according to the available data) and Abstracts Views on Vision4Press platform.
Data correspond to usage on the plateform after 2015. The current usage metrics is available 48-96 hours after online publication and is updated daily on week days.
Initial download of the metrics may take a while.