Fig. 6.
Download original image
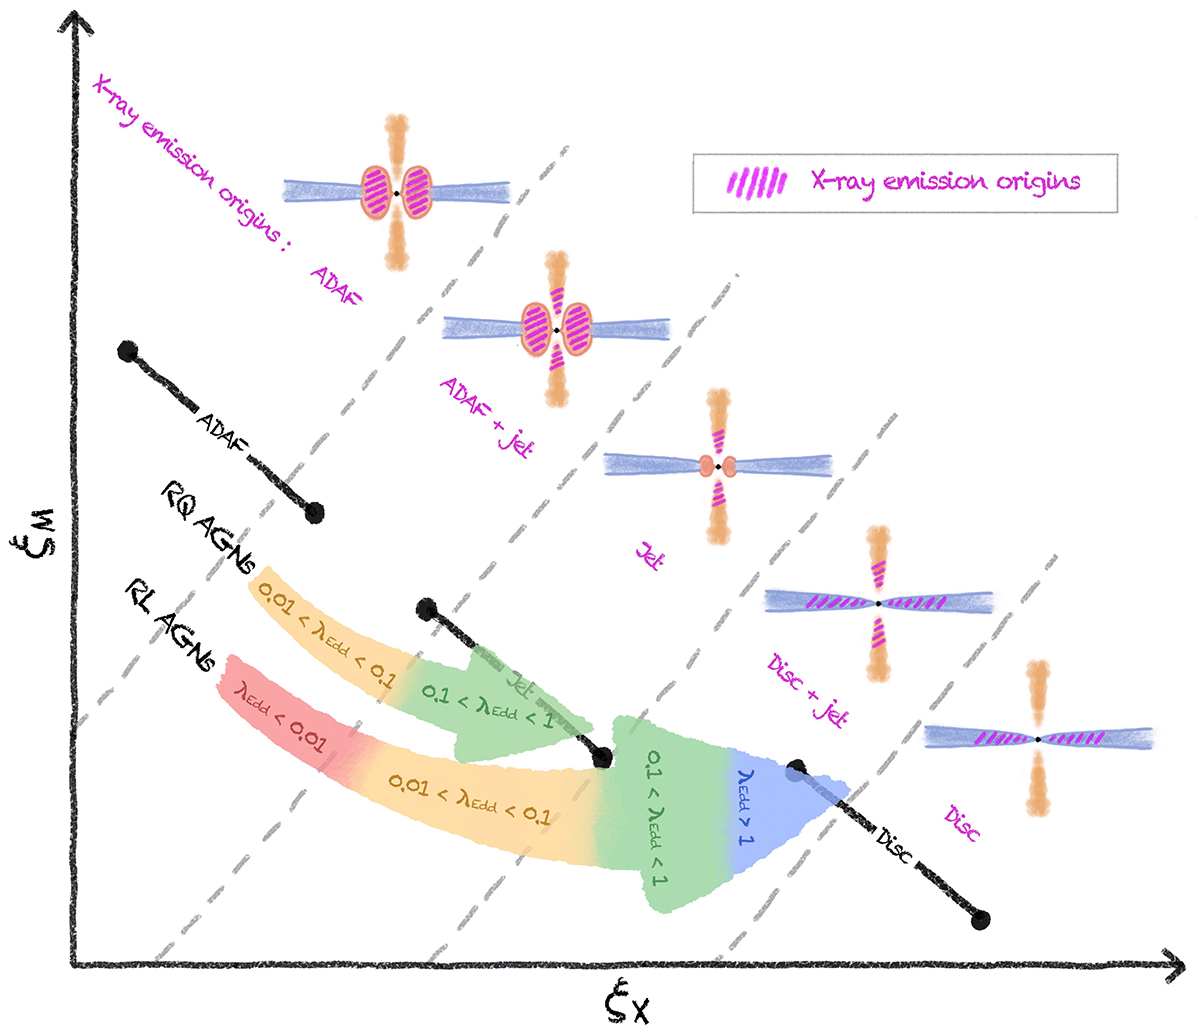
Cartoon illustrating the model for the central engine of radio-quiet AGNs and radio-loud AGNs. Solid black lines represent the theoretically predicted correlation coefficients for ADAF, jet, and standard thin disc models, which are same as Figs. 4 and 5. The upper colored arrow represents the observational results for radio-quiet (RQ) AGNs, while the lower colored arrow represents the observational results for radio-loud (RL) AGNs. The different colors of the arrow represent different Eddington ratios (λEdd) and the direction of the arrow means from low λEdd to high λEdd. The shaded violet regions represent the origins of X-ray emission. The origins of X-ray emission of radio-quiet AGNs at 0.01 < λEdd < 0.1 are consistent with a combination of ADAF and a synchrotron jet model (ADAF+jet model), while at 0.1 < λEdd < 1, they mainly follow the synchrotron jet model (Jet model). The origins of X-ray emission of radio-loud AGNs are consistent with a combination of ADAF and a synchrotron jet model (ADAF+jet model) at λEdd < 0.01, and agree with the synchrotron jet model (Jet model) at 0.01 < λEdd < 0.1, and follow the standard thin disc coupled with a synchrotron jet model (Disc+jet model) at λEdd > 0.1.
Current usage metrics show cumulative count of Article Views (full-text article views including HTML views, PDF and ePub downloads, according to the available data) and Abstracts Views on Vision4Press platform.
Data correspond to usage on the plateform after 2015. The current usage metrics is available 48-96 hours after online publication and is updated daily on week days.
Initial download of the metrics may take a while.