Fig. 5.
Download original image
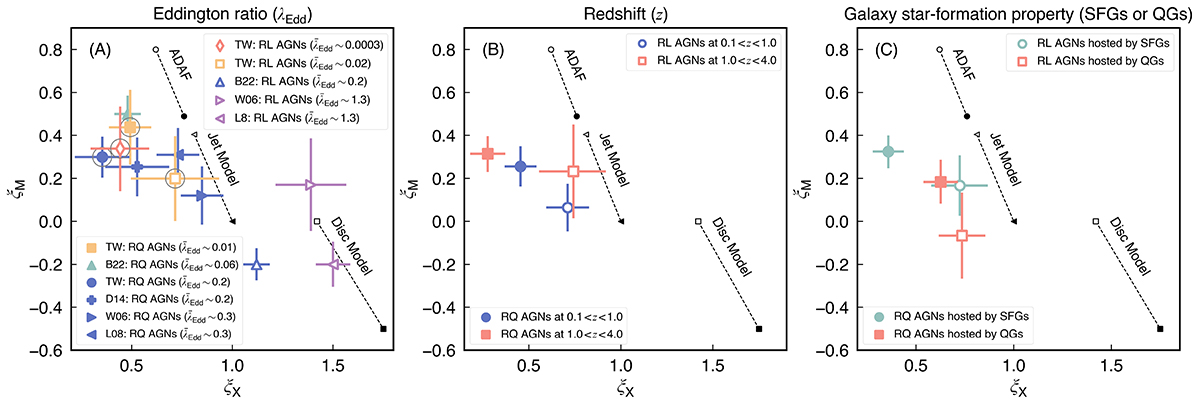
Comparison of the best-fit correlation coefficients, ξX and ξM, of the fundamental plane for Eddington ratio subsamples (A), redshift subsamples (B), and galaxy star formation property subsamples (C). The theoretically predicted correlation coefficients for ADAF, the synchrotron jet model, and the disc model are the same as in Fig. 4, and are shown here as circles, triangles, and squares, respectively. In each panel, filled symbols represent radio-quiet (RQ) AGNs and empty symbols represent radio-loud (RL) AGNs. In panel A, “TW”, “B22”, “D14”, “W06”, and “L08” mean results from this work, Bariuan et al. (2022), Dong et al. (2014), Wang et al. (2006), and Li et al. (2008), respectively. Different colors represent different Eddington ratios: red for ![]() , yellow for
, yellow for ![]() , green for
, green for ![]() , blue for
, blue for ![]() , and violet for
, and violet for ![]() . In addition, our results (TW) are labeled by big gray circles.
. In addition, our results (TW) are labeled by big gray circles.
Current usage metrics show cumulative count of Article Views (full-text article views including HTML views, PDF and ePub downloads, according to the available data) and Abstracts Views on Vision4Press platform.
Data correspond to usage on the plateform after 2015. The current usage metrics is available 48-96 hours after online publication and is updated daily on week days.
Initial download of the metrics may take a while.