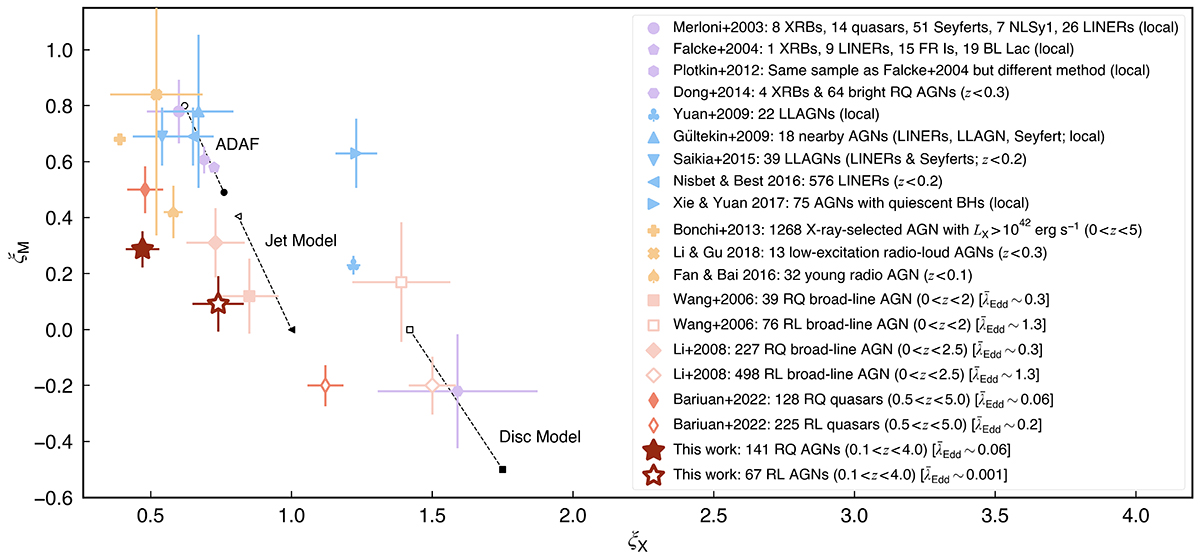
Fig. 4.
Download original image
Comparison of the best-fit correlation coefficients, ξX and ξM, of the fundamental plane. Our results for the radio-quiet (RQ) AGNs and radio-loud (RL) AGNs samples are shown as the filled dark red star and the empty dark red star, respectively. The results from literature works are shown as comparisons, including Merloni et al. (2003) (Merloni+2003), Falcke et al. (2004) (Falcke+2004), Plotkin et al. (2012) (Plotkin+2012), Dong et al. (2014) (Dong+2014), Yuan et al. (2009) (Yuan+2009), Gültekin et al. (2009b) (Gültekin+2009), Saikia et al. (2015) (Saikia+2015), Nisbet & Best (2016) (Nisbet & Best 2016), Xie & Yuan (2017) (Xie & Yuan 2017), Bonchi et al. (2013) (Bonchi+2013), Li & Gu (2018) (Li & Gu 2018), Fan & Bai (2016) (Fan & Bai 2016), Wang et al. (2006) (Wang+2006), Li et al. (2008) (Li+2008), and Bariuan et al. (2022) (Bariuan+2022). Purple symbols represent studies based on a sample consisting of both XRBs and local AGNs. Blue symbols represent studies based on LLAGNs. Yellow symbols represent studies for other types of AGNs. Red symbols represent studies for radio-quiet (filled symbols) and radio-loud (empty symbols) AGNs separately. The theoretically predicted correlation coefficients were derived from Merloni et al. (2003) with the electron spectral index p = 2, and are shown as black circles for the ADAF, black triangles for a synchrotron jet model, and black squares for the standard Shakura–Sunyaev disc model. Among them, empty and filled symbols represent the predictions based on a radio spectral index of 0 and −0.5, respectively, and the dashed lines connecting the empty and filled symbols represent the tracks of ξX and ξM due to the variation in the radio spectral index.
Current usage metrics show cumulative count of Article Views (full-text article views including HTML views, PDF and ePub downloads, according to the available data) and Abstracts Views on Vision4Press platform.
Data correspond to usage on the plateform after 2015. The current usage metrics is available 48-96 hours after online publication and is updated daily on week days.
Initial download of the metrics may take a while.