Fig. 3.
Download original image
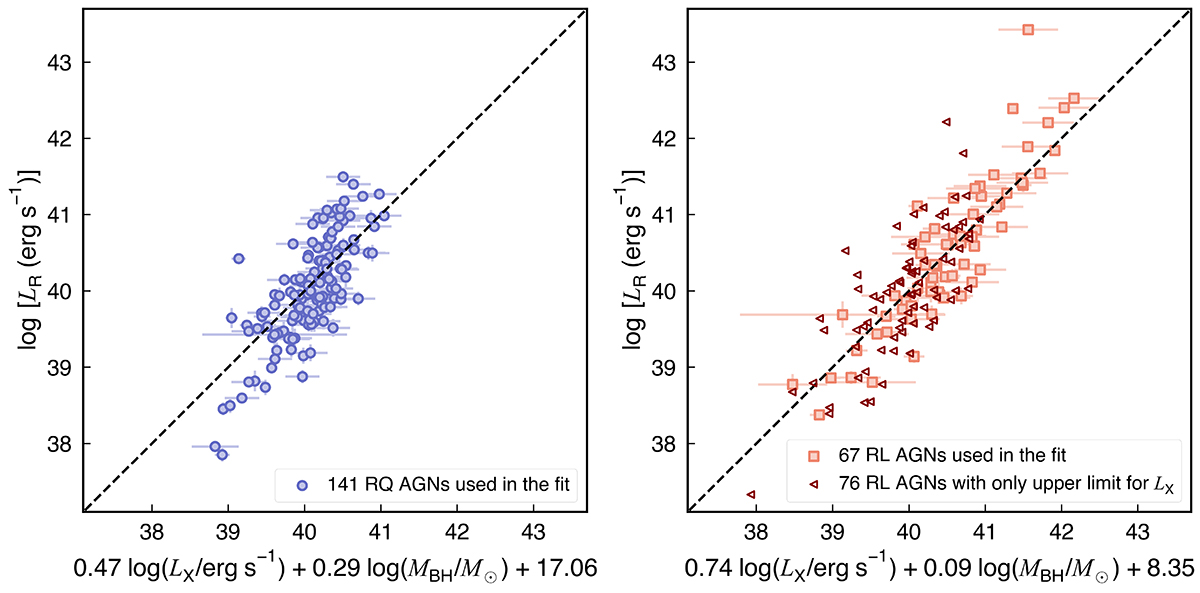
Comparison of the predicted rest-frame 5 GHz luminosity from the best-fit fundamental plane (x axis) and the observed rest-frame 5 GHz luminosity (y axis) for the radio-quiet AGNs (left panel) and the radio-loud AGNs (right panel). The dashed black line in each panel represents the 1:1 line. The empty dark red triangles in the right panel represent the radio-loud AGNs with only upper limits for LX (see parameter calculation in Section 3.3 and see sample selection in Section 5) that were not utilized in the regression fitting for the fundamental plane.
Current usage metrics show cumulative count of Article Views (full-text article views including HTML views, PDF and ePub downloads, according to the available data) and Abstracts Views on Vision4Press platform.
Data correspond to usage on the plateform after 2015. The current usage metrics is available 48-96 hours after online publication and is updated daily on week days.
Initial download of the metrics may take a while.