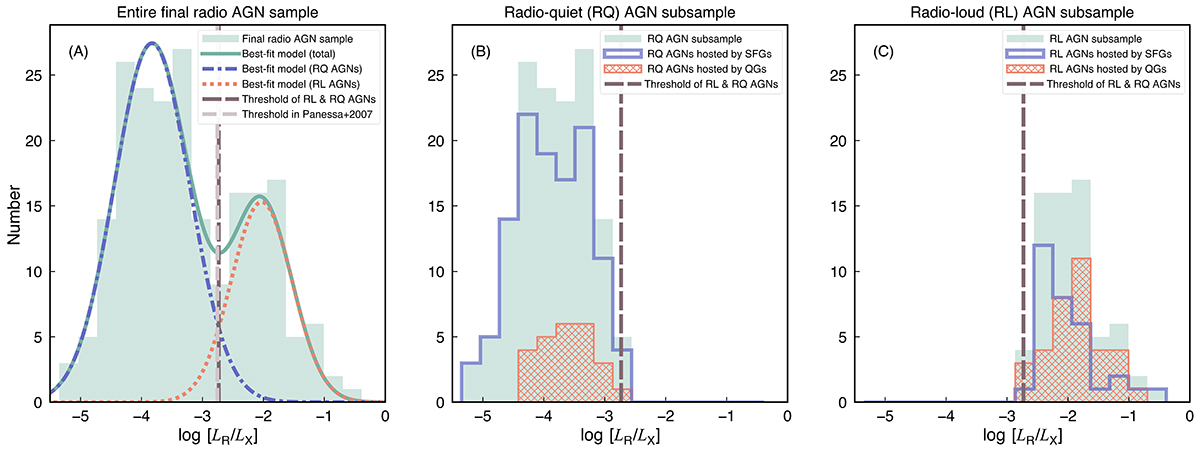
Fig. 1.
Download original image
Distribution of the ratio of the rest-frame 5 GHz radio luminosity (LR) to the rest-frame 2–10 keV X-ray luminosity (LX) for the entire final radio AGN sample (panel A), the radio-quiet AGN subsample (panel B), and the radio-loud AGN subsample (panel C). The solid green curve in panel A represents the best-fit model to the entire distribution, which consists of two single Gaussian models (the dash-dotted blue curve and the dotted red curve). The vertical dashed dark gray line in all panels represents the cross point between two single models, which is defined as the radio-loudness threshold to divide radio-loud and radio-quiet AGNs in this work. The vertical dashed light gray line in panel A represents the radio-loudness threshold in Panessa et al. (2007), which was obtained by a sample consisting of local Seyferts and low-luminosity radio galaxies. The blue and red histograms in panel B represent the radio-quiet AGNs hosted by SFGs and QGs, respectively, while in panel C, they represent the radio-loud AGNs hosted by SFGs and QGs, respectively.
Current usage metrics show cumulative count of Article Views (full-text article views including HTML views, PDF and ePub downloads, according to the available data) and Abstracts Views on Vision4Press platform.
Data correspond to usage on the plateform after 2015. The current usage metrics is available 48-96 hours after online publication and is updated daily on week days.
Initial download of the metrics may take a while.