Fig. 9
Download original image
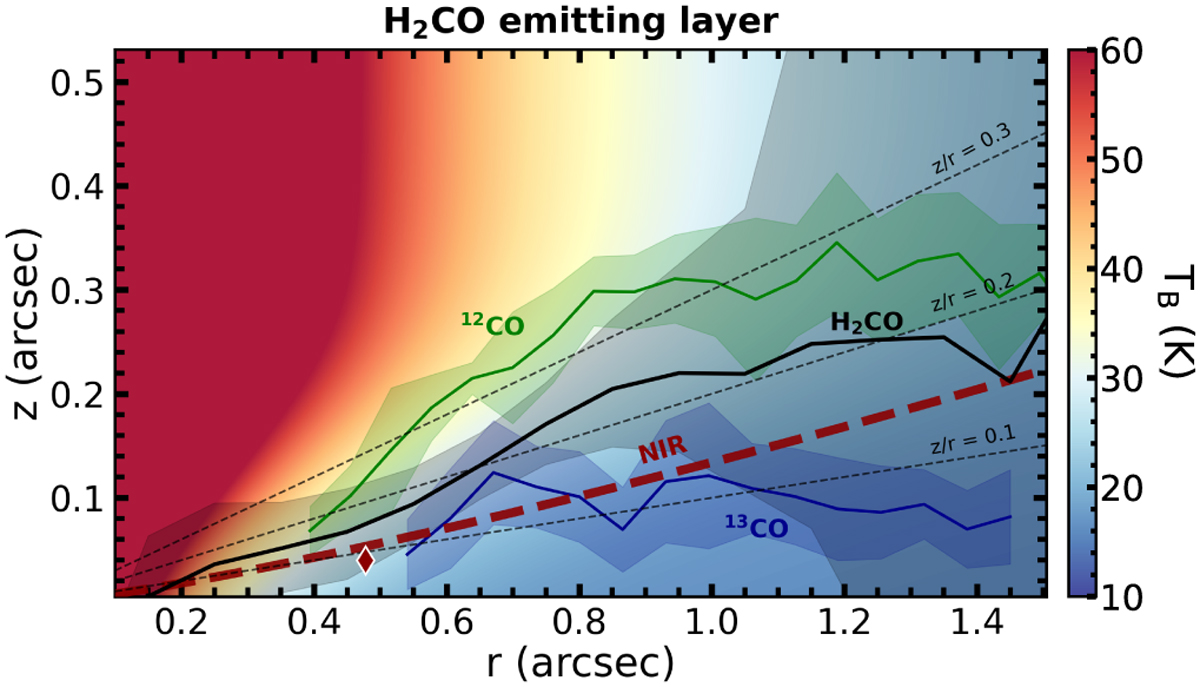
H2CO emitting layer height as a function of radius (solid black line), and the related uncertainty (black ribbons), compared to the 2D temperature structure in the background (Law et al. 2024). The two solid green and blue lines refer to the 12CO and 13CO emission surfaces, with related uncertainties, respectively (Law et al. 2024). The dashed red line refers to the NIR scale height as a function of radius, from Keppler et al. (2018), while the red diamond is the height of the NIR emitting layer at the NIR ring ~![]() (Law et al. 2024). Dashed black lines indicate fixed z/r layers.
(Law et al. 2024). Dashed black lines indicate fixed z/r layers.
Current usage metrics show cumulative count of Article Views (full-text article views including HTML views, PDF and ePub downloads, according to the available data) and Abstracts Views on Vision4Press platform.
Data correspond to usage on the plateform after 2015. The current usage metrics is available 48-96 hours after online publication and is updated daily on week days.
Initial download of the metrics may take a while.