Fig. 8
Download original image
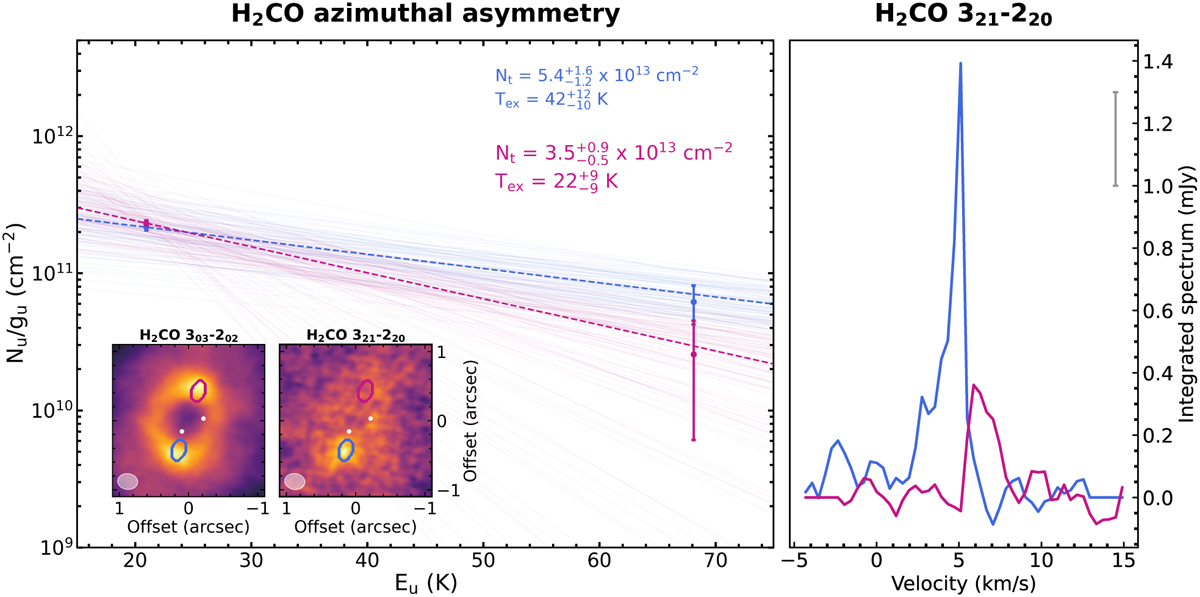
Azimuthal asymmetry of the H2CO 32,1−22,0 line emission. Left panel: rotational diagram analysis applied to the two regions, highlighted in the integrated intensity maps of the two lines of the H2CO molecule: the pink region corresponds to PA = 0°, while the blue one is at PA = 180° along the major axis. The dashed pink and blue lines correspond to the best fit Nt and Tex (reported in the top right corner) obtained for the pink and blue region, respectively. Right panel: spatially integrated spectra of the H2CO 32,1–22,0 line in the pink region and the blue region (lines in corresponding colors). The gray error bar in the top right of the panel is the uncertainty on the spatially integrated flux derived from the non-JvM corrected cube, which is the same for each velocity bin.
Current usage metrics show cumulative count of Article Views (full-text article views including HTML views, PDF and ePub downloads, according to the available data) and Abstracts Views on Vision4Press platform.
Data correspond to usage on the plateform after 2015. The current usage metrics is available 48-96 hours after online publication and is updated daily on week days.
Initial download of the metrics may take a while.