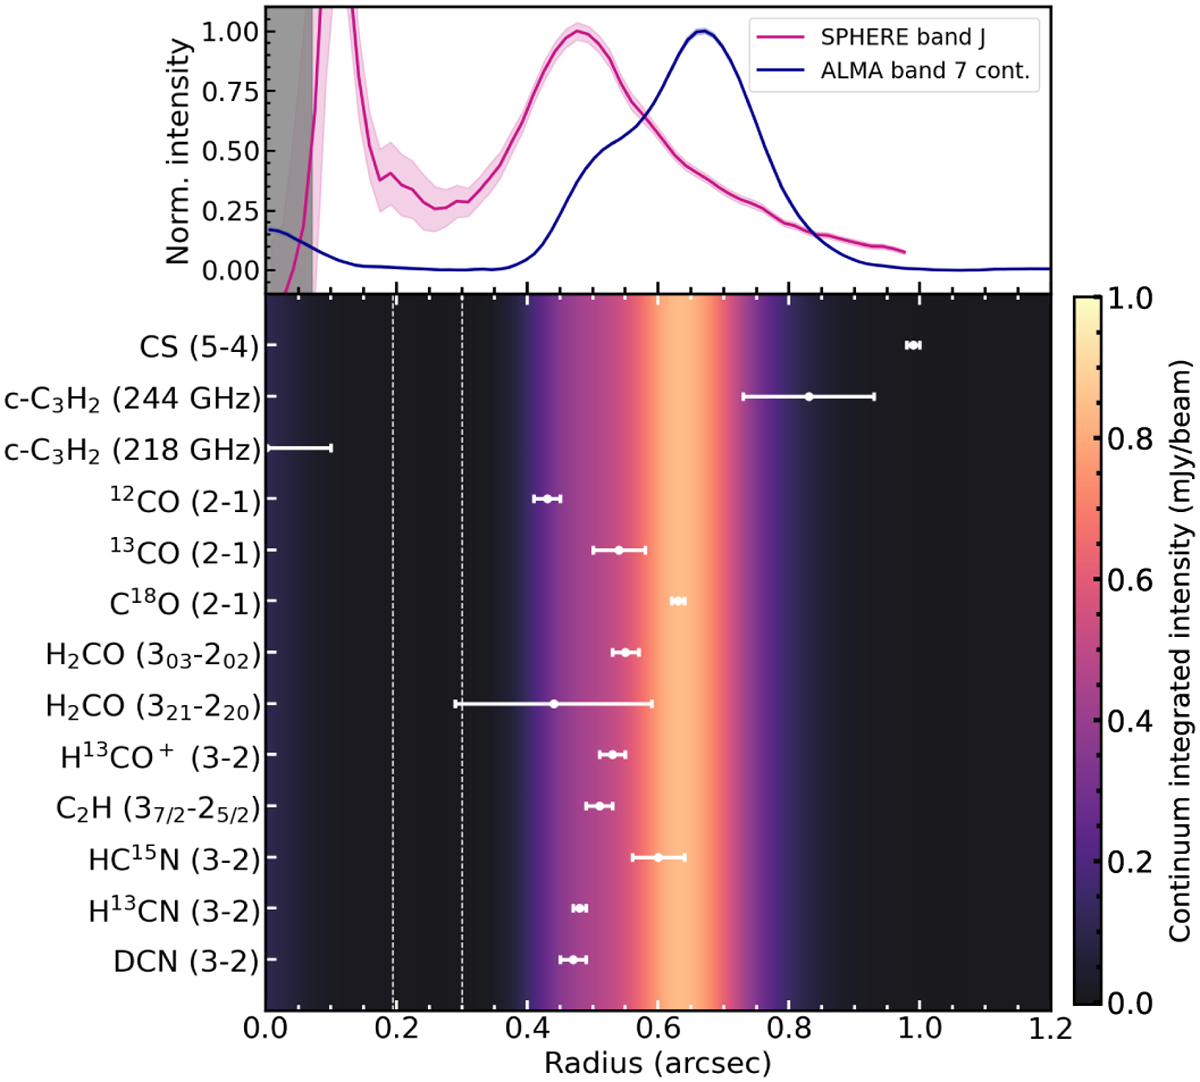
Fig. 7
Download original image
Radial location of the peak of the emission of the various molecular tracers, compared to radial profiles of SPHERE scattered light and ALMA band 7 continuum intensity. Top panel: radial profiles of the ALMA band 7 continuum intensity (blue line, Isella et al. 2019) and SPHERE J-band polarized intensity (pink line, Keppler et al. 2018). The gray shadow shows the radius of the coronagraph in the J-band observations (Keppler et al. 2018). Bottom panel: radial position of the peak of the emission and its related uncertainty, for each detected line. The background color-bar refers to the radial profile of the ALMA band 7 continuum intensity. The two vertical dashed white lines indicate the planets position (Wang et al. 2021).
Current usage metrics show cumulative count of Article Views (full-text article views including HTML views, PDF and ePub downloads, according to the available data) and Abstracts Views on Vision4Press platform.
Data correspond to usage on the plateform after 2015. The current usage metrics is available 48-96 hours after online publication and is updated daily on week days.
Initial download of the metrics may take a while.