Fig. 5
Download original image
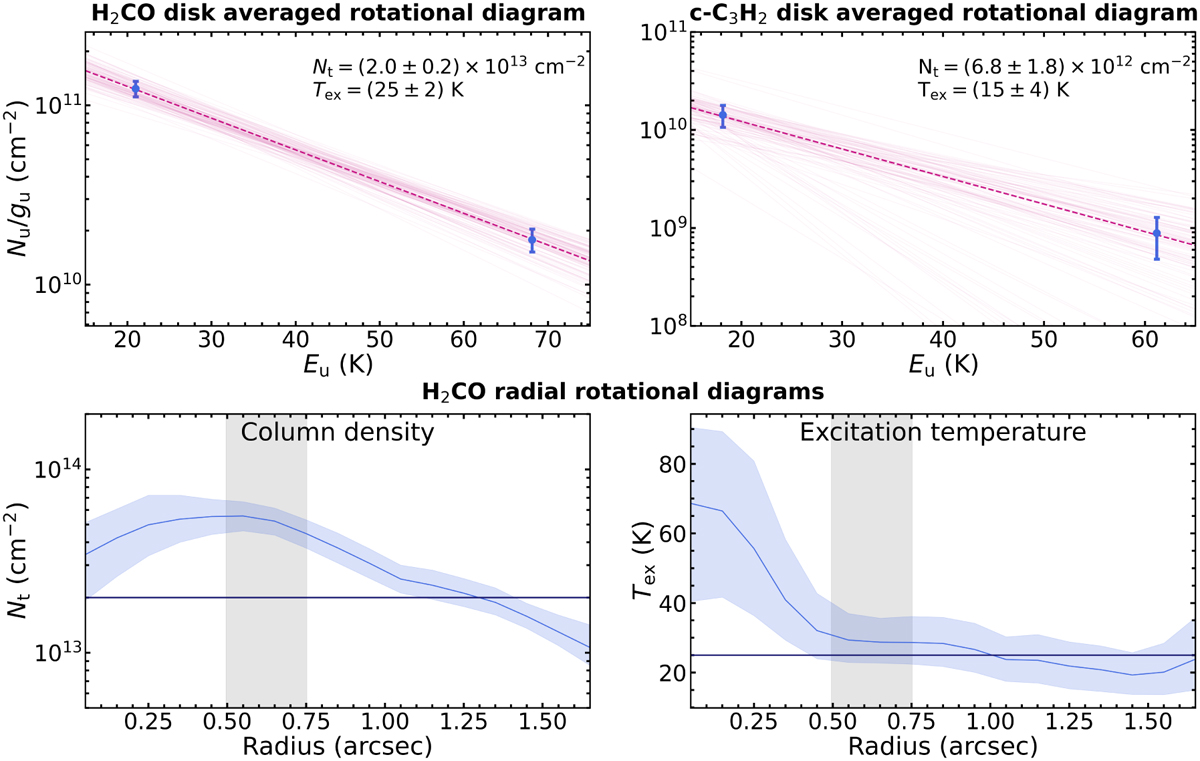
Rotational diagram analysis of H2CO and c-C3H2. First row: disk-averaged rotational diagram analysis applied to the two lines of the H2CO and c-C3H2 molecules, respectively. The average excitation temperatures and column densities are indicated on the top of the two panels. The dashed lines correspond to the best fit results for Nt and Tex, while the solid lines are 100 random results from the posterior distribution of the emcee fit. Bottom row: radial profiles of the total column density (left panel) and of the excitation temperature (right panel) from H2CO rotational diagram analysis, applied to ![]() wide annuli. The solid lines show the median of the posterior distribution (which is representative of the best fit as the posterior distribution is well described by a Gaussian) from the emcee fit, for Nt and Tex, while the ribbons represent the 16th and 84th percentiles. The horizontal dark blue line shows the results from the disk-average rotational diagram (from top left panel). Gray regions mark the radial range of the expected location of the CO snowline (Law et al. 2024).
wide annuli. The solid lines show the median of the posterior distribution (which is representative of the best fit as the posterior distribution is well described by a Gaussian) from the emcee fit, for Nt and Tex, while the ribbons represent the 16th and 84th percentiles. The horizontal dark blue line shows the results from the disk-average rotational diagram (from top left panel). Gray regions mark the radial range of the expected location of the CO snowline (Law et al. 2024).
Current usage metrics show cumulative count of Article Views (full-text article views including HTML views, PDF and ePub downloads, according to the available data) and Abstracts Views on Vision4Press platform.
Data correspond to usage on the plateform after 2015. The current usage metrics is available 48-96 hours after online publication and is updated daily on week days.
Initial download of the metrics may take a while.