Fig. 2
Download original image
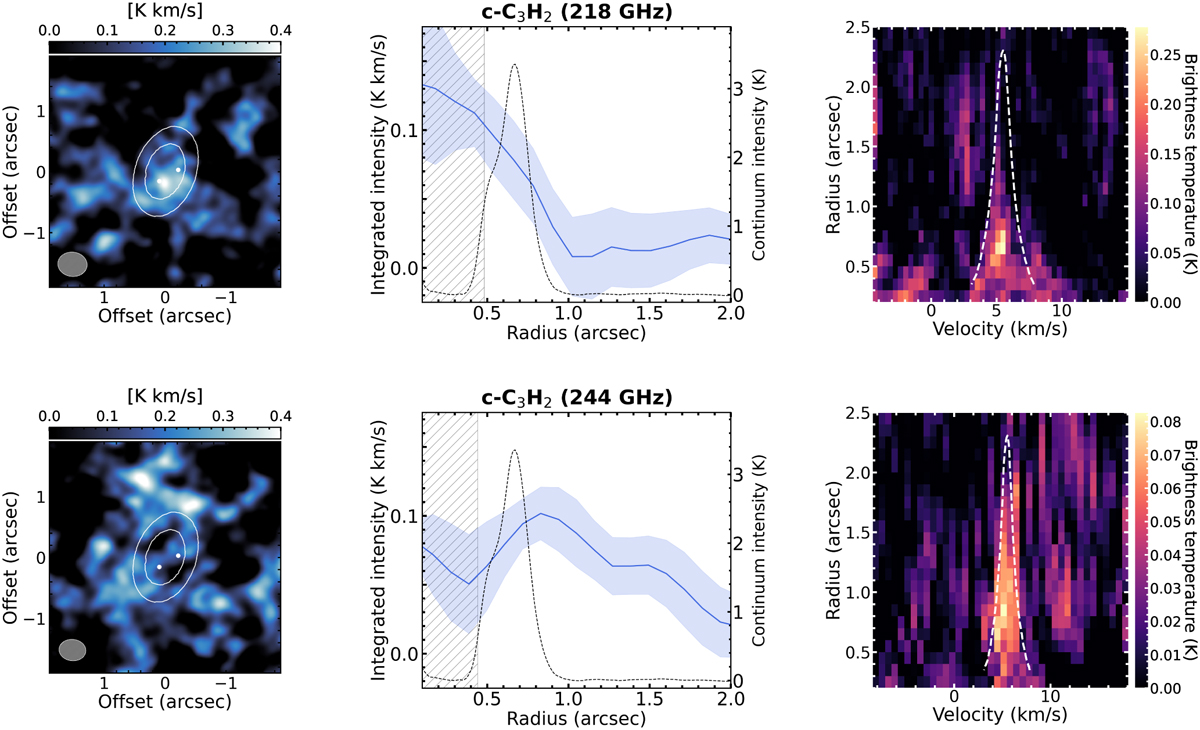
Detection of the c-C3H2 transitions at 218 GHz (top row) and at 244 GHz (bottom row). Panels in the left column show the integrated intensity maps obtained from the imaged data cubes with natural weighting and an additional uv-tapering. The white contours show the band 7 submillimeter continuum bright ring, and the two white dots indicate the location of the two gas giants (Wang et al. 2021), while the white ellipses on the bottom left are the beams. Panels in the central column represent the radial profiles of the azimuthally averaged integrated intensity, obtained as described in Sec. 4.2, for c-C3H2 transitions (blue line), and for the 855 μm continuum emission (dashed black line, Isella et al. 2019). The hatched gray region indicates the beam major axis. Panels in the right column show the Keplerian shifted line spectra, in brightness temperature, as a function of radius, for each ![]() wide annulus in which the disk has been divided. The dashed white lines are the 3K level of the 12CO.
wide annulus in which the disk has been divided. The dashed white lines are the 3K level of the 12CO.
Current usage metrics show cumulative count of Article Views (full-text article views including HTML views, PDF and ePub downloads, according to the available data) and Abstracts Views on Vision4Press platform.
Data correspond to usage on the plateform after 2015. The current usage metrics is available 48-96 hours after online publication and is updated daily on week days.
Initial download of the metrics may take a while.