Fig. 10
Download original image
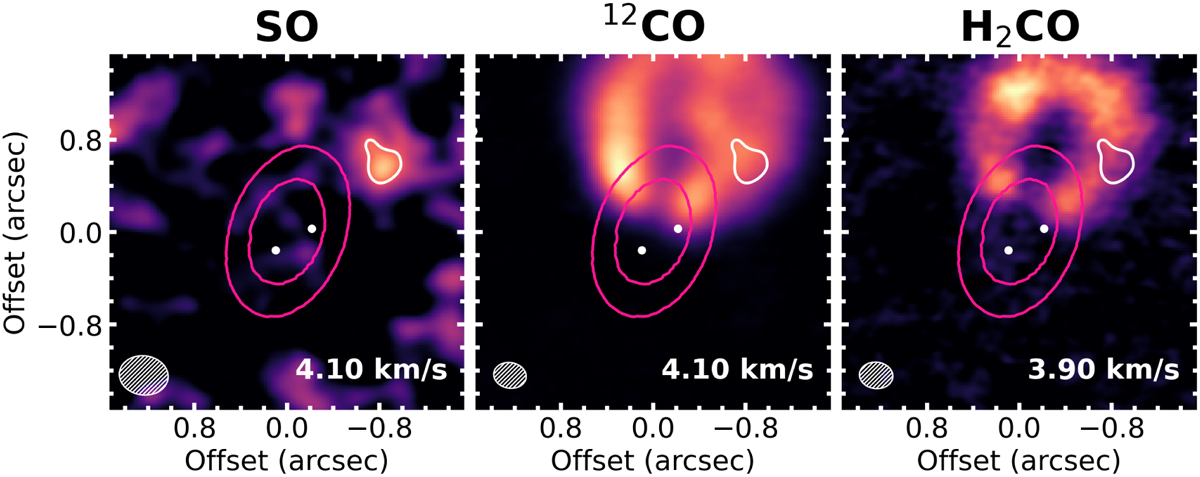
Channel maps around 4 km s−1 showing the spatial distribution of the emission of three different molecules: SO (stacked), 12CO and H2CO, from left to right. The white contour shows the 3σ level of the SO emission, which is reported in the other channel maps for reference. The pink contours indicate the bright ring in the band 7 continuum emission (Isella et al. 2019), while the two white dots mark the position of the two protoplanets (Wang et al. 2021). The white ellipse in the bottom left side of each panel is the beam of each imaged cube.
Current usage metrics show cumulative count of Article Views (full-text article views including HTML views, PDF and ePub downloads, according to the available data) and Abstracts Views on Vision4Press platform.
Data correspond to usage on the plateform after 2015. The current usage metrics is available 48-96 hours after online publication and is updated daily on week days.
Initial download of the metrics may take a while.