Fig. 1
Download original image
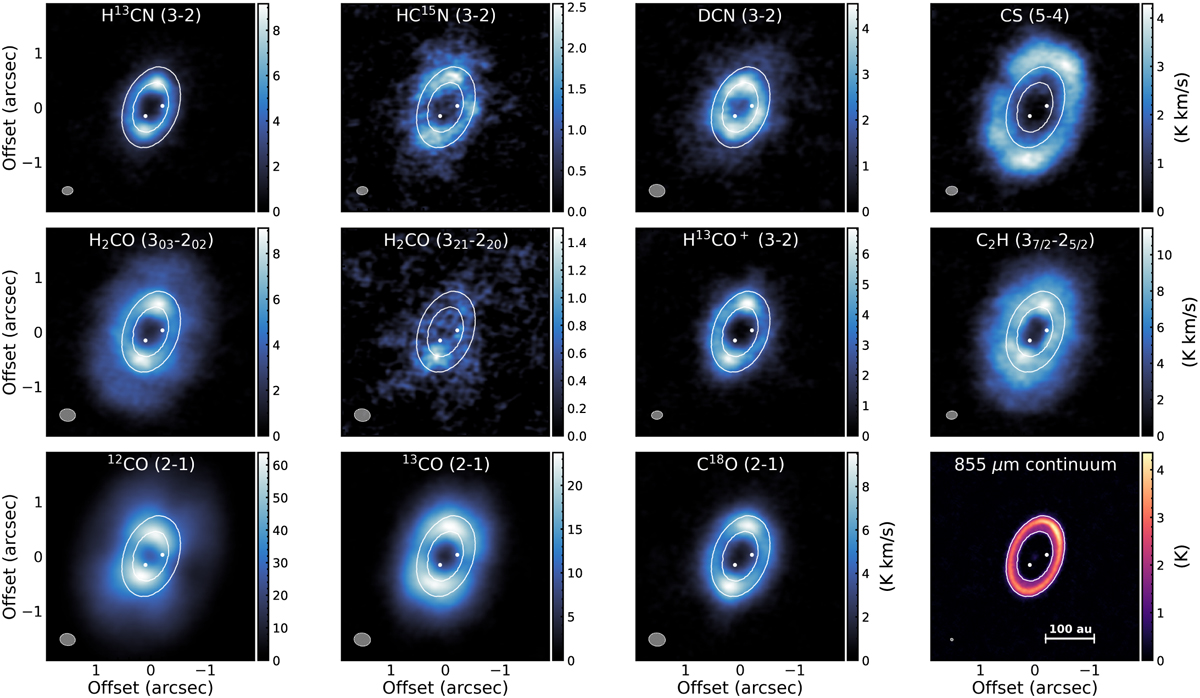
Integrated intensity maps of the detected lines, and of the 855 μm continuum (Isella et al. 2019), with the white contours showing the bright ring in the submillimeter continuum emission and the white dots marking the position of the two forming planets (Wang et al. 2021). Brightness temperatures were obtained under the assumption of Rayleigh-Jeans approximation. The white ellipse at the bottom left of each panel is the beam, while the white line at the bottom right of the last panel indicates the 100 au scale.
Current usage metrics show cumulative count of Article Views (full-text article views including HTML views, PDF and ePub downloads, according to the available data) and Abstracts Views on Vision4Press platform.
Data correspond to usage on the plateform after 2015. The current usage metrics is available 48-96 hours after online publication and is updated daily on week days.
Initial download of the metrics may take a while.