Fig. 8
Download original image
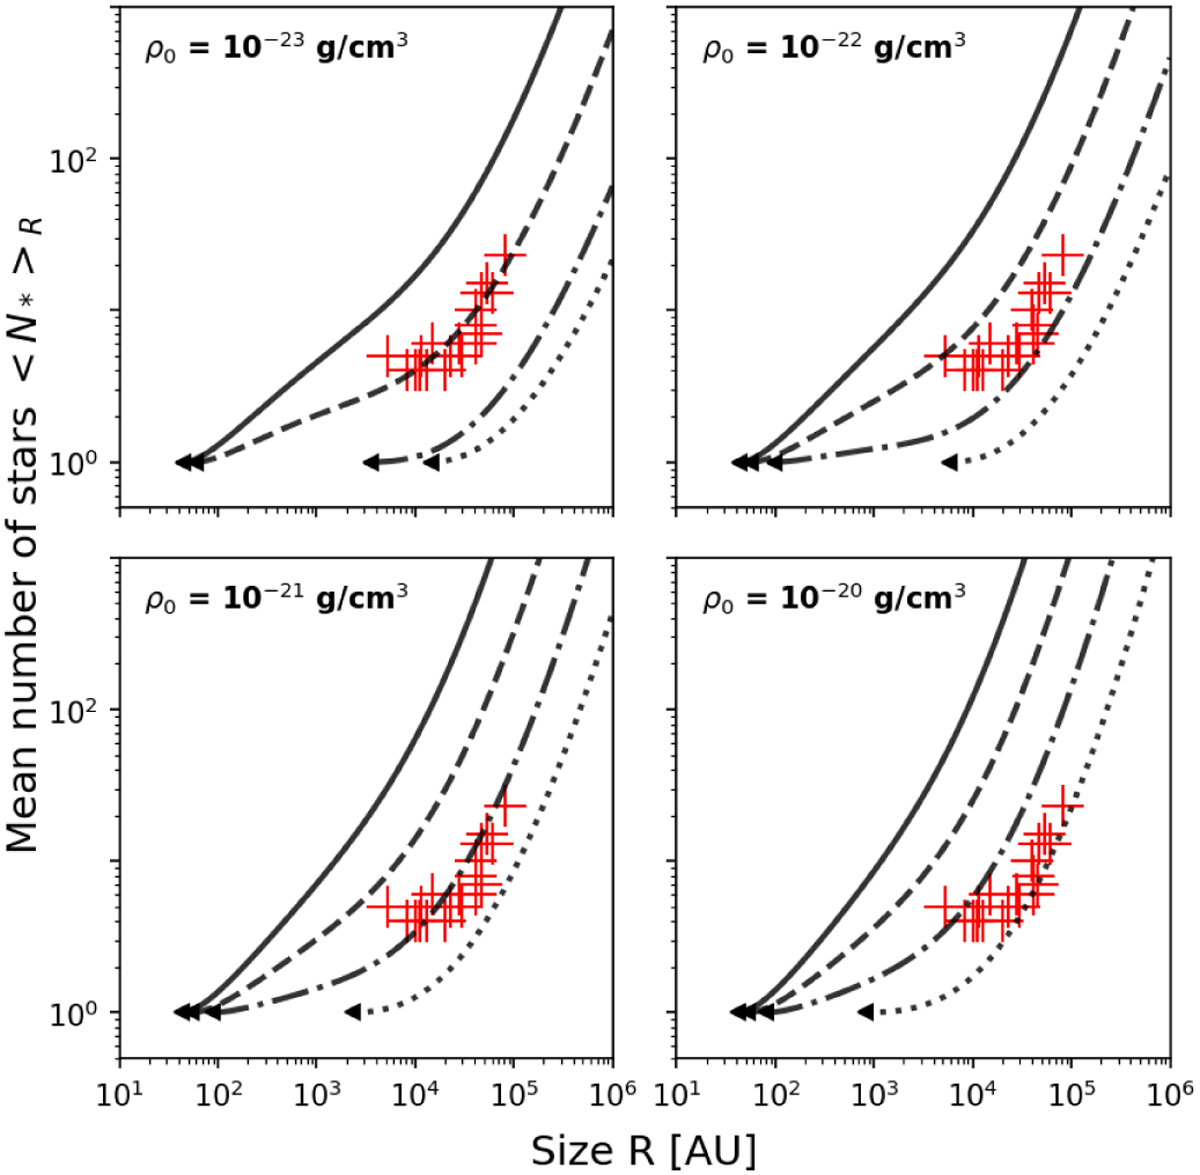
Average number of stars 〈N*〉R located within a region of size R for different initial cloud density ρ0 as predicted by our model of fragmentation. The solid, dashed, dot-dashed, and dotted curve represent our model for different mass transfer rates ξ = 0, −0.25, −0.5, −0.75, respectively. The triangles mark the points below which gas clumps do not fragment anymore. The crosses represent the number of YSOs in NESTs (Joncour et al. 2018) as a function of their size, as observed in the Taurus cloud.
Current usage metrics show cumulative count of Article Views (full-text article views including HTML views, PDF and ePub downloads, according to the available data) and Abstracts Views on Vision4Press platform.
Data correspond to usage on the plateform after 2015. The current usage metrics is available 48-96 hours after online publication and is updated daily on week days.
Initial download of the metrics may take a while.