Fig. 7
Download original image
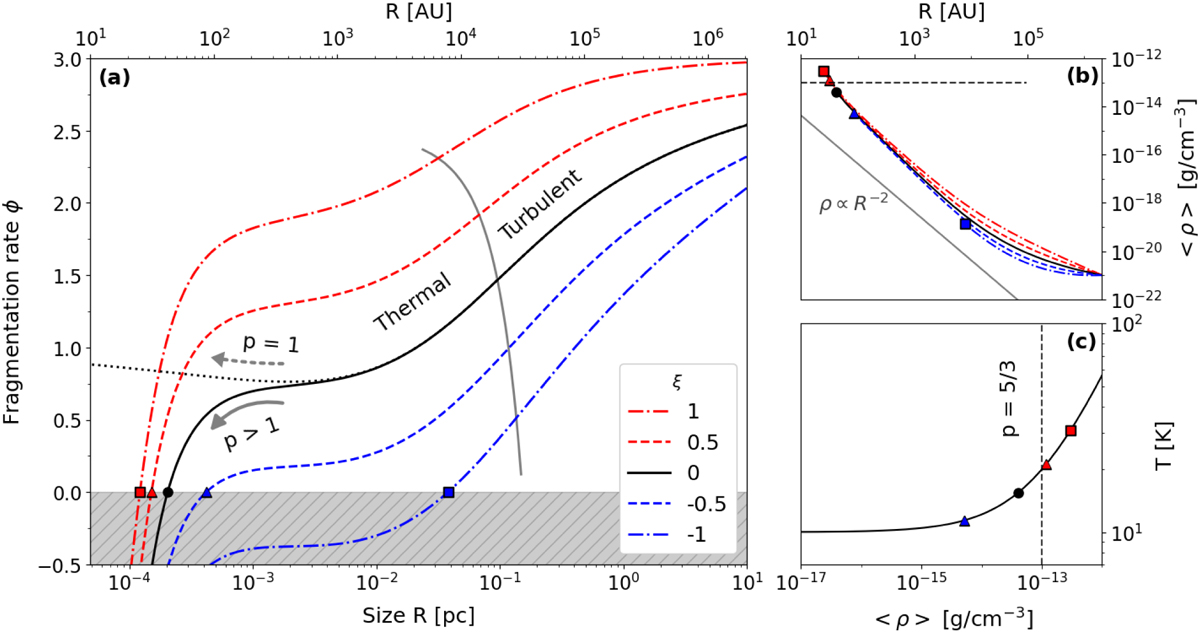
Theoretical variations in the fragmentation rate φ (a), the mean fragment density 〈ρ〉 (b) as a function of the spatial scale R for different mass transfer rates ξ. These profiles were computed using an adiabatic EOS (c), a cloud initial size R0 = 10 pc with an initial density ρ0 = 10−21 g/cm3. Red triangle, black dot, blue triangle, and blue square indicate the position of the last fragmenting structures for mass transfer rates ξ = 1,0.5,0, −0.5, −1, respectively. (a) The black dotted line is associated with an isothermal EOS with a polytropic index p = 1. The transition between turbulent and thermal fragmentation is delimited by the grey line. (b) The black dashed line indicates the density of the first Larson core (Larson 1969) when p = 5/3. (c) Evolution of temperature T as a function of fragments density.
Current usage metrics show cumulative count of Article Views (full-text article views including HTML views, PDF and ePub downloads, according to the available data) and Abstracts Views on Vision4Press platform.
Data correspond to usage on the plateform after 2015. The current usage metrics is available 48-96 hours after online publication and is updated daily on week days.
Initial download of the metrics may take a while.