Fig. 3.
Download original image
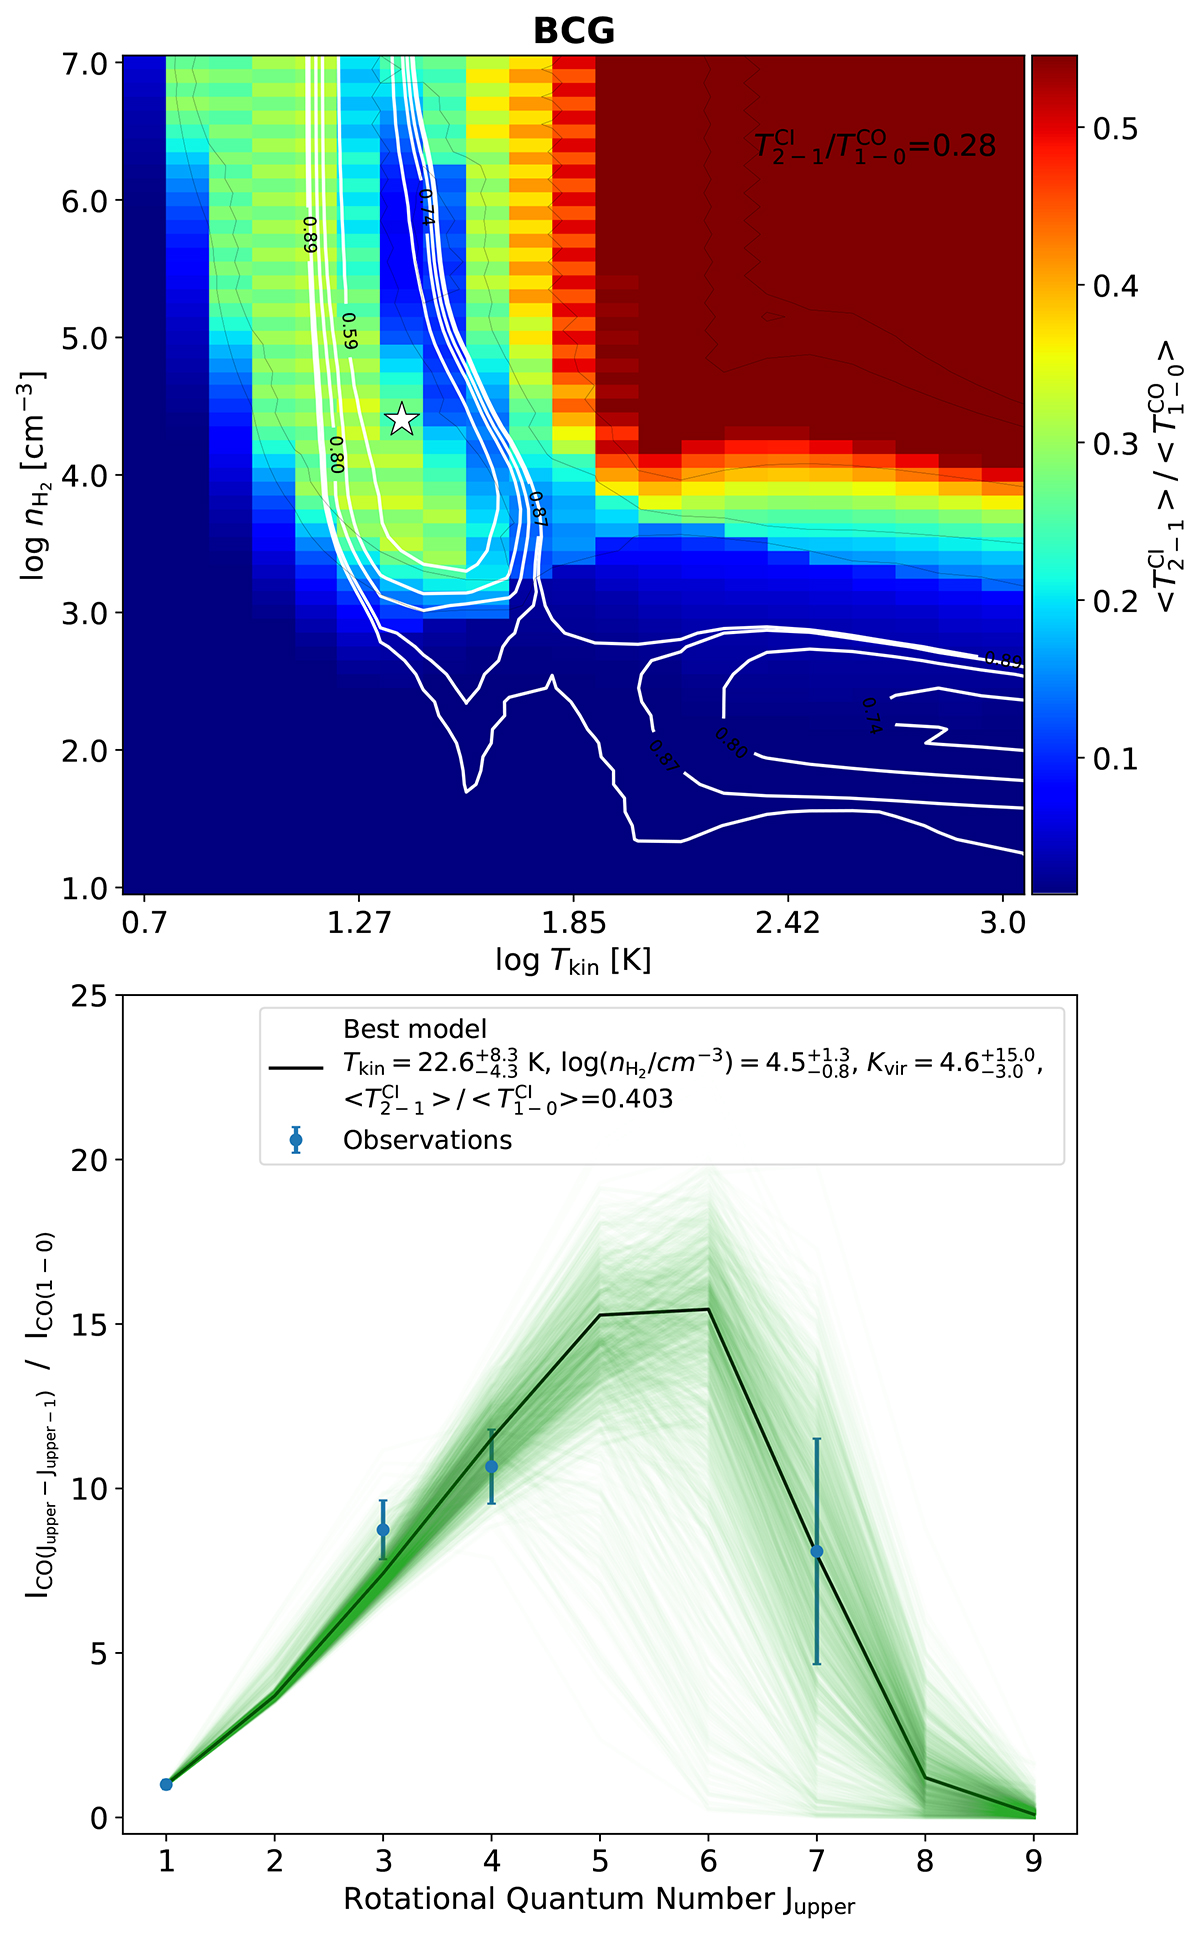
Top: LVG modelling for the BCG of MACS1931. The Tkin, nH2 grid is plotted with a projected Kvir axis. At each point of the Tkin, nH2 grid, the colour shows the predicted [CI](2−1)/12CO(1−0) ratio of the model with the highest likelihood among models with different Kvir values. The black contours show the levels of the modelled [CI](2−1)/12CO(1−0) flux ratio which is shown by colours. The white contours show the likelihood levels. The white star indicates the best-fitted LVG model obtained from MCMC simulations. Bottom: The CO SLED of the best-fitted LVG model for BCG. The black curve shows the modelled CO SLED. The blue points with blue error bars show the observed line flux ratios. The green curves show the distribution of best models obtained from MCMC.
Current usage metrics show cumulative count of Article Views (full-text article views including HTML views, PDF and ePub downloads, according to the available data) and Abstracts Views on Vision4Press platform.
Data correspond to usage on the plateform after 2015. The current usage metrics is available 48-96 hours after online publication and is updated daily on week days.
Initial download of the metrics may take a while.