Fig. 2.
Download original image
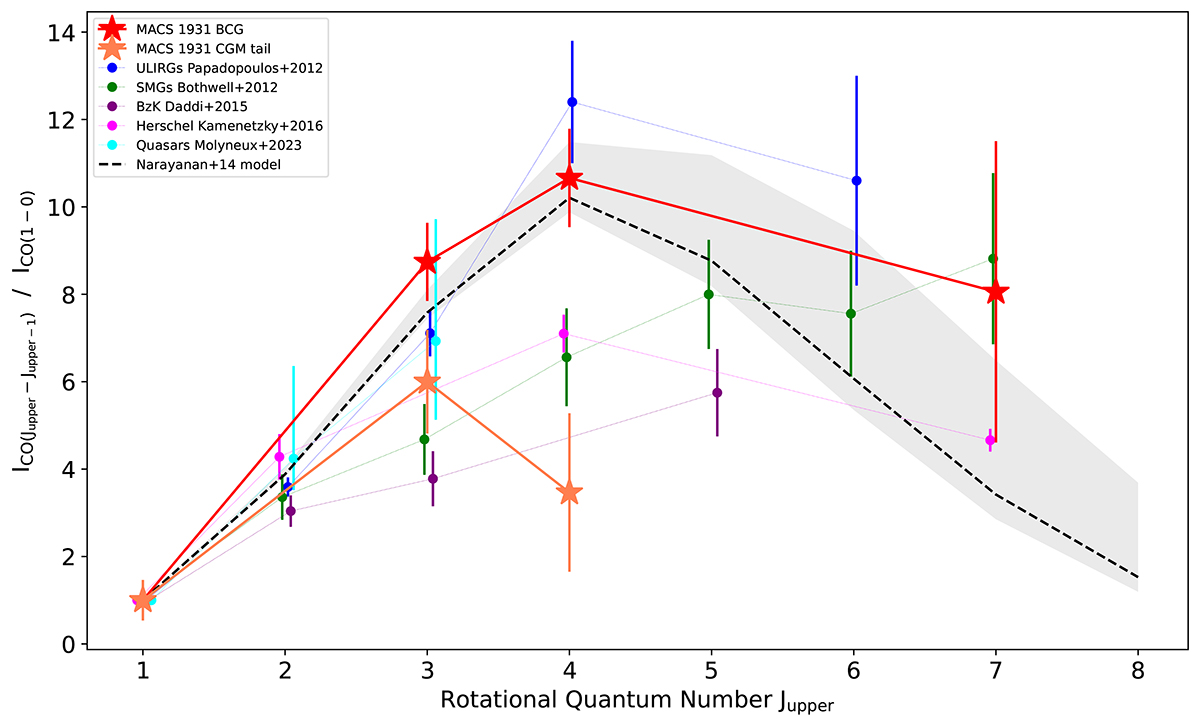
CO SLED built with the available data for the BCG and the CGM tail of MACS1931 (red and orange stars, respectively). The CO line fluxes are taken from Fogarty et al. (2019), except 12CO(7−6) of the BCG which is detected in this work using APEX. Line fluxes are normalised to the 12CO(1−0) flux taken from Fogarty et al. (2019). Additional average CO SLEDs from the literature are added for comparison: ULIRGs from Papadopoulos et al. (2012a, blue circles), SMGs from Bothwell et al. (2013, green circles), BzK galaxies from Daddi et al. (2015, purple circles), low-redshift Herschel galaxies from Kamenetzky et al. (2016, magenta circles), and quasars from the QFeedS sample published in Molyneux et al. (2023, cyan circles). The dashed black line shows the theoretical CO SLED for resolved objects with ΣSFR = 0.83 M⊙ yr−1 kpc−2 modelled by Narayanan & Krumholz (2014). This value is the estimated ΣSFR for the MACS1931 BCG (Fogarty et al. 2015). The grey shaded area shows the predicted CO SLED range with this model for 0.6 < ΣSFR [M⊙ yr−1 kpc−2] < 3. We report an upper limit on the 12CO(7−6) flux for the tail in Table 2, however, it is not constraining the tail CO SLED and falls out of the range of this plot.
Current usage metrics show cumulative count of Article Views (full-text article views including HTML views, PDF and ePub downloads, according to the available data) and Abstracts Views on Vision4Press platform.
Data correspond to usage on the plateform after 2015. The current usage metrics is available 48-96 hours after online publication and is updated daily on week days.
Initial download of the metrics may take a while.