Fig. 1.
Download original image
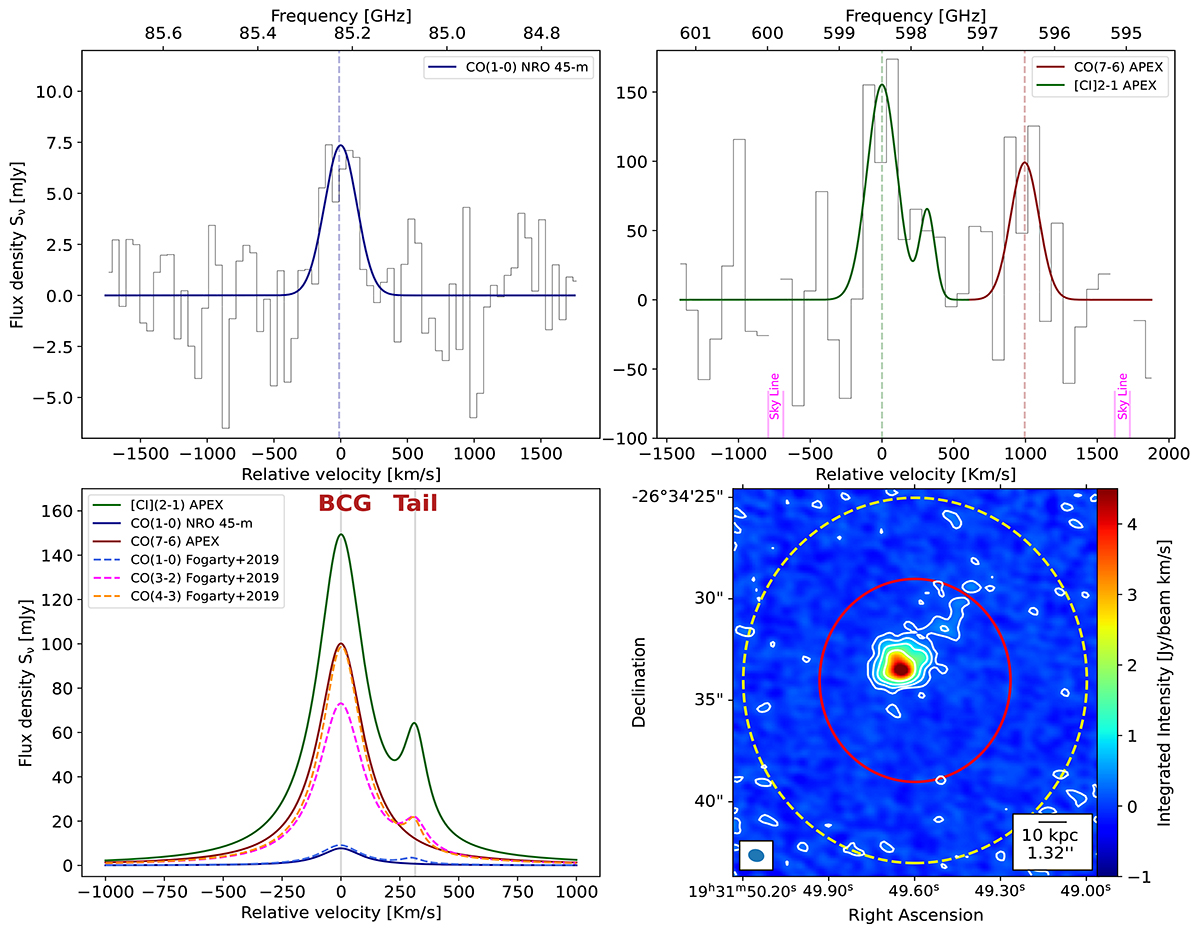
Submillimeter observations towards MACS1931. Upper left: Gaussian fit to the 12CO(1−0) line in the NRO 45-m observations of MACS1931. The black histogram shows the spectrum. The blue solid curve shows the Gaussian fit to the line. Upper right: Gaussian fit to the [CI](2−1) and 12CO(7−6) lines in the APEX observations of MACS1931. The black histogram shows the spectrum. The green and red solid curves show the Gaussian fits to the [CI](2−1) and 12CO(7−6) lines, respectively. The magenta solid lines show the regions of the spectrum excluded because of the atmospheric lines. Lower left: Best-fit line profiles of 12CO(1−0), 12CO(3−2), and 12CO(4−3) from Fogarty et al. (2019) (dashed curves) and Lorentzian fits on 12CO(1−0), 12CO(7−6), and [CI](2−1) from this work (solid curves) displayed on the same plot for comparison (see Sect. 3 and Table 1). The CGM tail peak of the 12CO(4−3) line from Fogarty et al. (2019) is the best fit to a partially truncated spectrum due to a spectral window gap in the ALMA Band 7 observations. Lower right: The ALMA 12CO(3−2) intensity map of the MACS1931 BCG and the tail. The moment zero map is calculated over a range of [ − 500, 600] km s−1. ALMA beam is shown by an ellipse on the bottom left side of the image. The APEX and NRO 45-m HPBWs are shown by solid red and dashed yellow circles. Contours are calculated on the moment map with levels [0.2, 0.5, 1, 2]σ and σ = 0.297 Jy beam−1 km s−1. The CGM tail component of the spectra is detectable in the [CI](2−1) line as well as all lines from Fogarty et al. (2019).
Current usage metrics show cumulative count of Article Views (full-text article views including HTML views, PDF and ePub downloads, according to the available data) and Abstracts Views on Vision4Press platform.
Data correspond to usage on the plateform after 2015. The current usage metrics is available 48-96 hours after online publication and is updated daily on week days.
Initial download of the metrics may take a while.