Fig. 6
Download original image
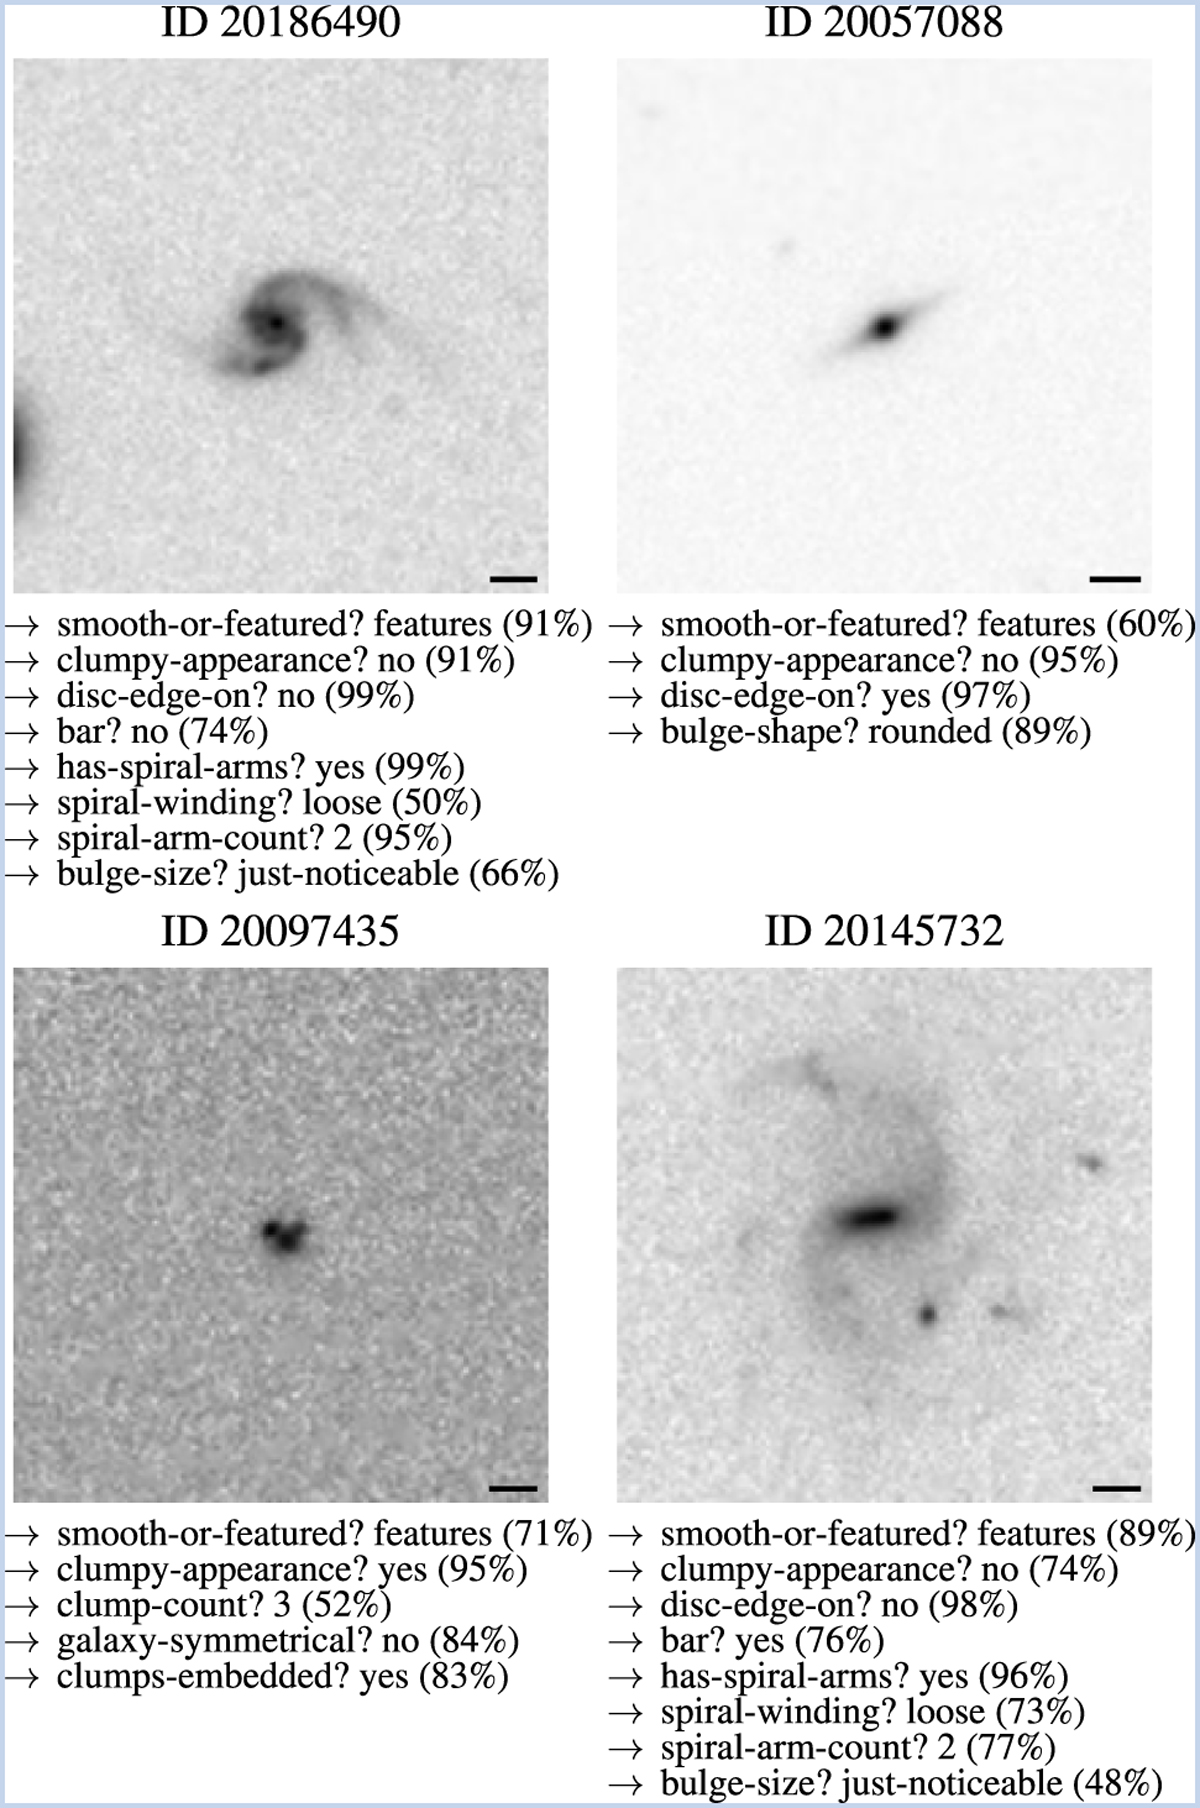
Four examples of the predictions of Zoobot following the structure of the GZH decision tree (see Table 1 and Fig. A.1) for galaxies (inverted greyscale, image ID given above each image) from the complete test set. For every question, the answer with the highest predicted vote fraction (denoted in the parenthesis) is selected. The black bars represent a length of 1″.
Current usage metrics show cumulative count of Article Views (full-text article views including HTML views, PDF and ePub downloads, according to the available data) and Abstracts Views on Vision4Press platform.
Data correspond to usage on the plateform after 2015. The current usage metrics is available 48-96 hours after online publication and is updated daily on week days.
Initial download of the metrics may take a while.