Open Access
Fig. 8
Download original image
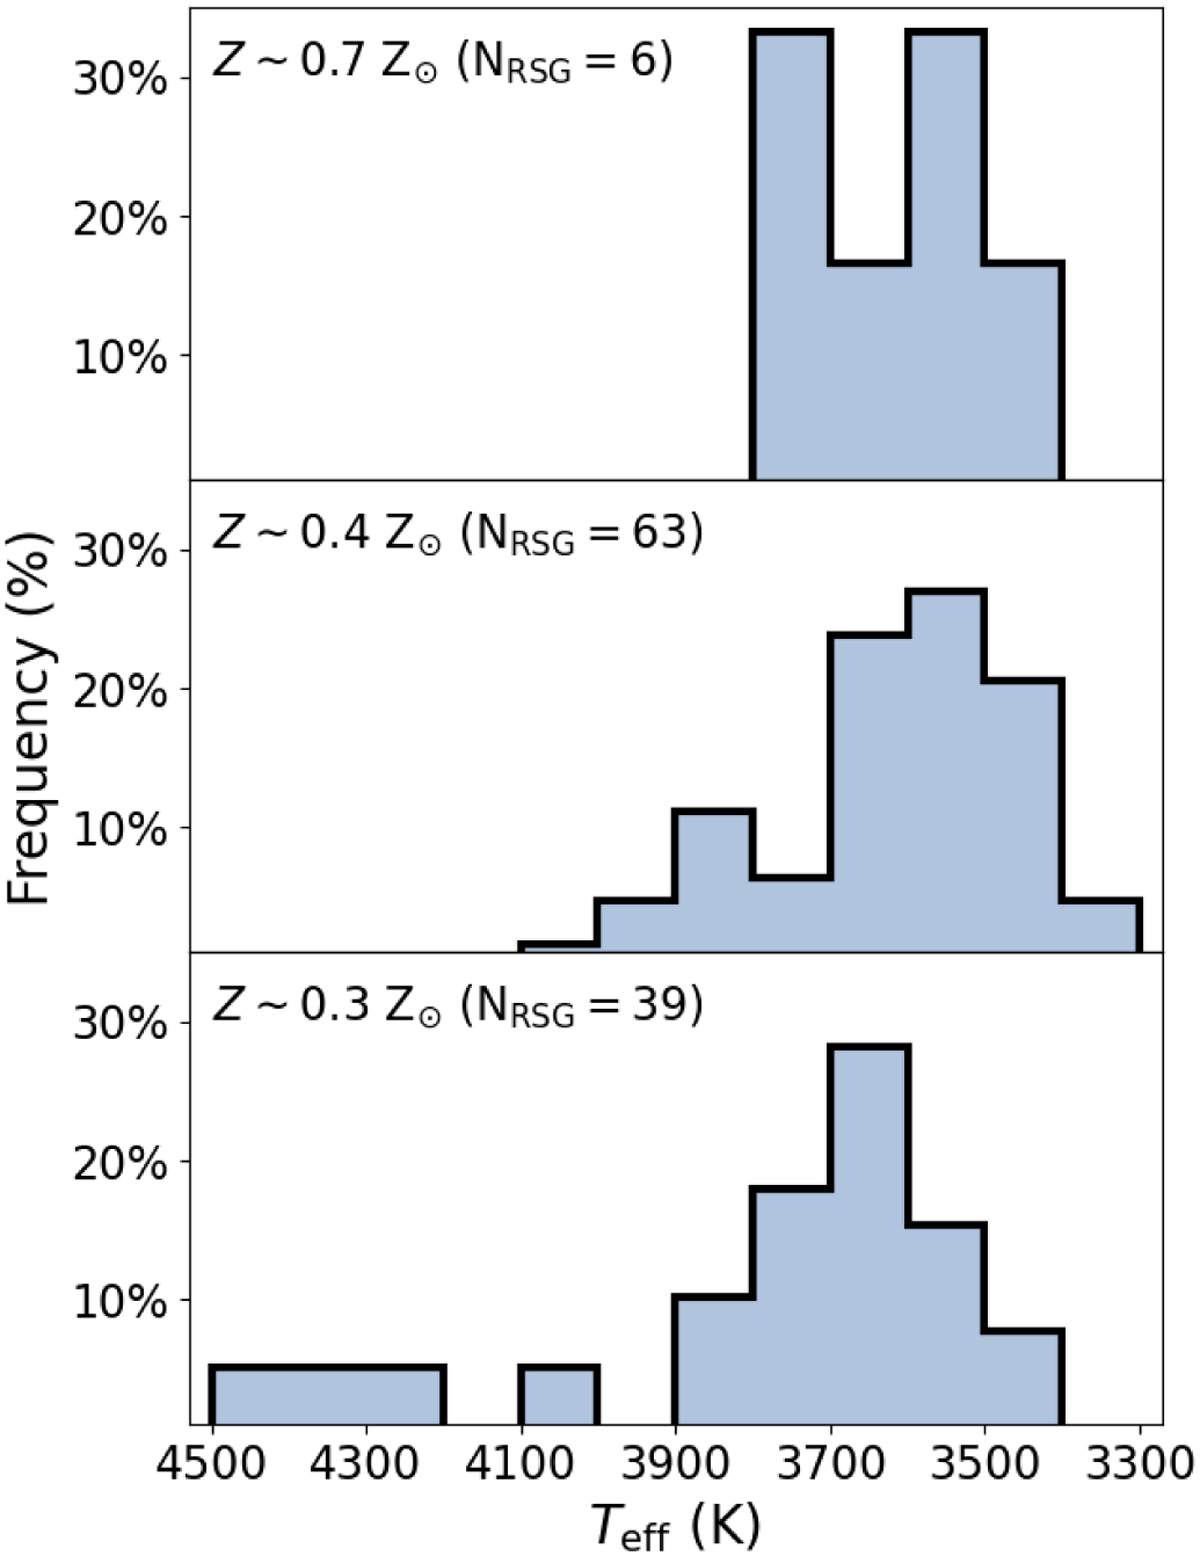
Normalized histogram of the Teff distribution of our RSG sample for 0.7 Z⊙ (NGC 253; top), 0.4 Z⊙ (NGC 300, NGC 247, and NGC 7793; middle), and 0.3 Z⊙ (NGC 55 and NGC 1313; bottom), excluding sources with flags 2–4.
Current usage metrics show cumulative count of Article Views (full-text article views including HTML views, PDF and ePub downloads, according to the available data) and Abstracts Views on Vision4Press platform.
Data correspond to usage on the plateform after 2015. The current usage metrics is available 48-96 hours after online publication and is updated daily on week days.
Initial download of the metrics may take a while.