Fig. 4
Download original image
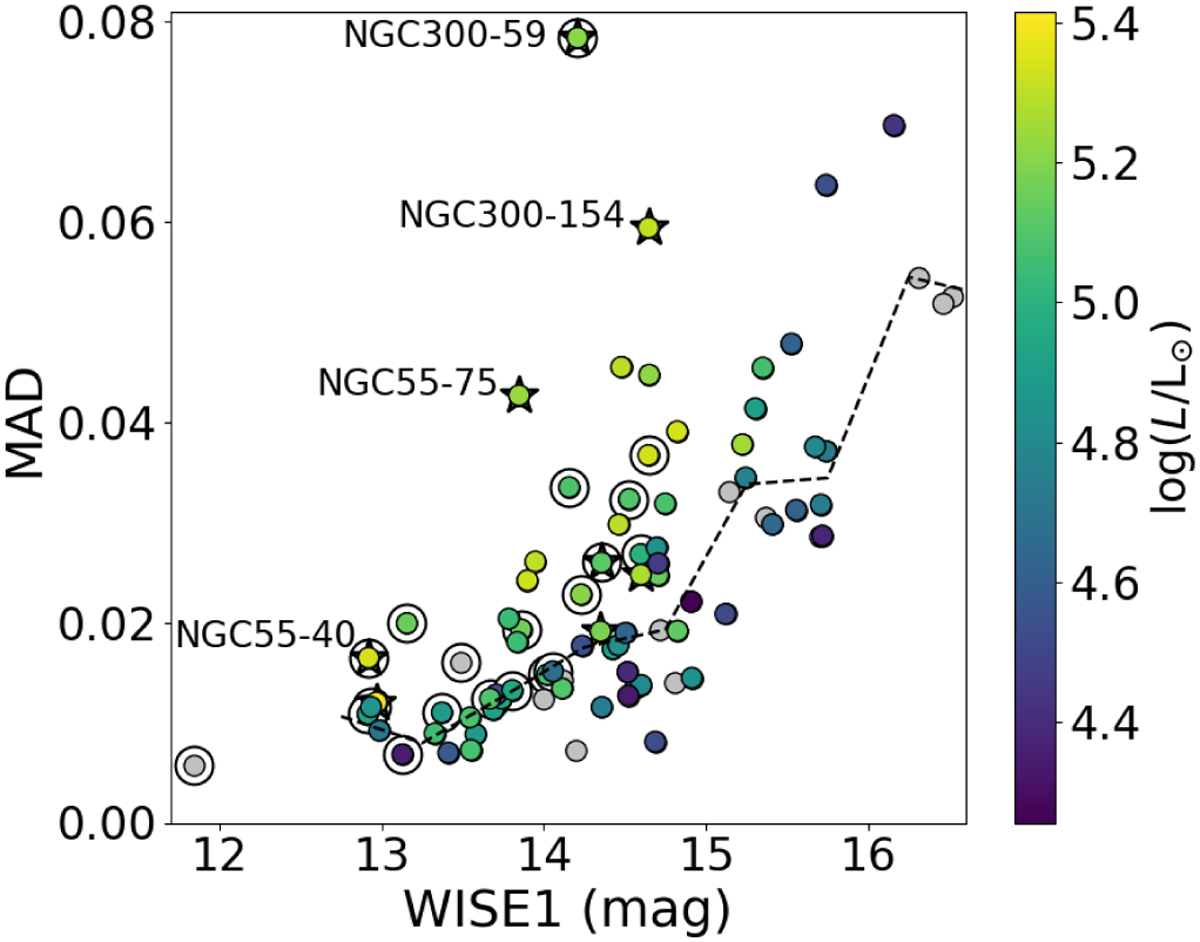
WISE1 versus MADwise1 diagram for RSGs in NGC 55 and NGC 300. The color bar indicates the luminosity for each RSG, and the gray dots indicate cases where a luminosity was not obtained. Black stars indicate eight RSGs that were reported as variable in optical surveys. Open circles indicate dusty RSGs. The dashed black curve indicates the median MAD for non-dusty RSGs. Four RSGs with both optical variability and a high MAD value relative to their WISE1 magnitude are labeled.
Current usage metrics show cumulative count of Article Views (full-text article views including HTML views, PDF and ePub downloads, according to the available data) and Abstracts Views on Vision4Press platform.
Data correspond to usage on the plateform after 2015. The current usage metrics is available 48-96 hours after online publication and is updated daily on week days.
Initial download of the metrics may take a while.