Fig. 11
Download original image
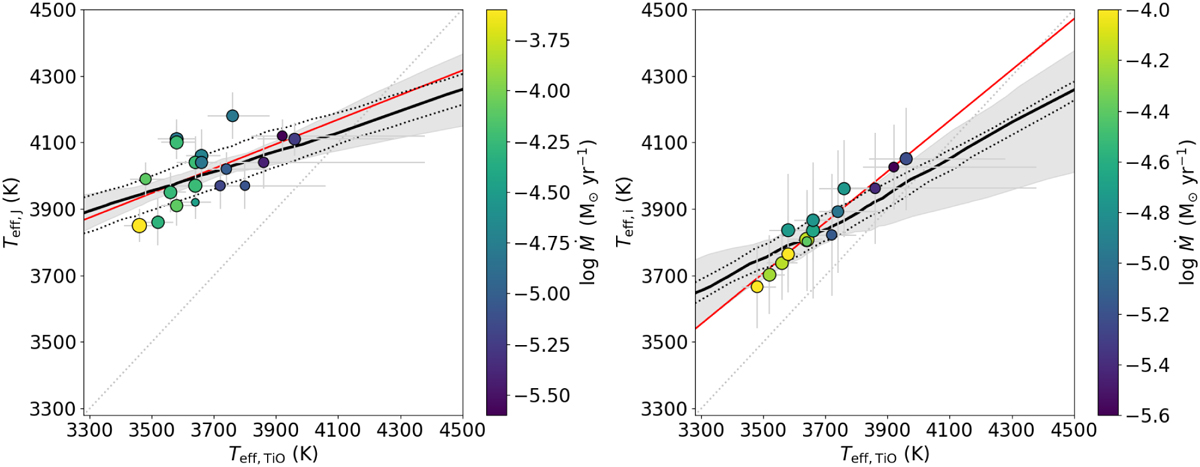
Scaling relations between Teff,TiO and Teff,J (left) and between Teff,TiO and Teff,i (right). The scattered data points and their uncertainties are taken from Davies et al. (2013, 2015). The thick black line indicates the best-fit scaling relation, the gray shaded band shows the combination of slopes and offsets acceptable within a 1σ uncertainty and the black dotted lines indicate the scatter on the best-fit relation. In red, we show a simple linear fit to the data when one excludes the effect of asymmetric uncertainties. We show a 1:1 relation for comparison. The color bar indicates the mass-loss rates obtained with DUSTY. The sizes of the markers increase proportionally to metallicity.
Current usage metrics show cumulative count of Article Views (full-text article views including HTML views, PDF and ePub downloads, according to the available data) and Abstracts Views on Vision4Press platform.
Data correspond to usage on the plateform after 2015. The current usage metrics is available 48-96 hours after online publication and is updated daily on week days.
Initial download of the metrics may take a while.