Fig. 1
Download original image
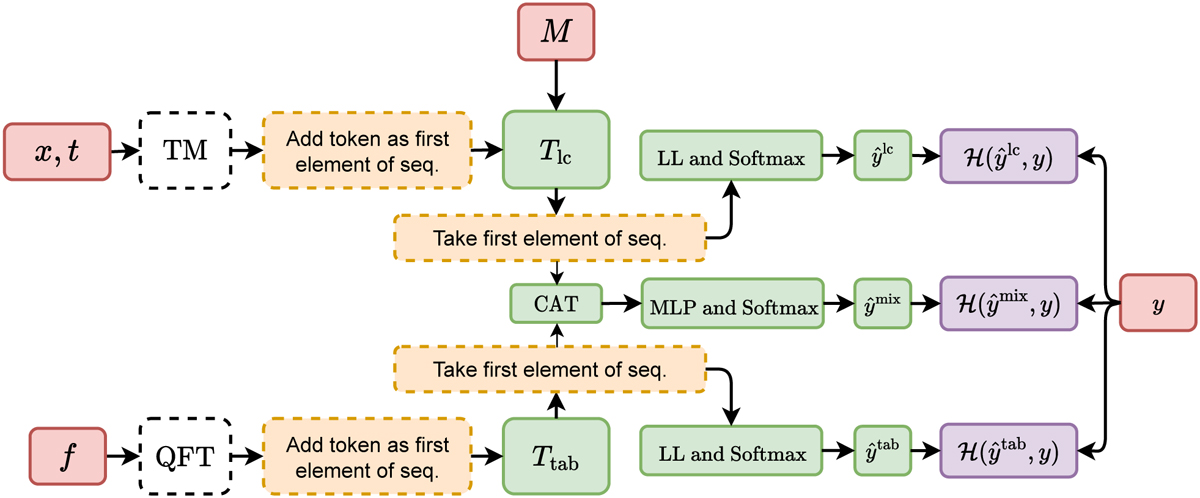
Diagram of ATAT, which consists of two branches: 1) at the top a transformer to process light curves (matrices x, t, and M) and 2) at the bottom a transformer to process tabular data (matrix ƒ). The information sources are respectively processed by time modulation (TM) and quantile feature tokenizers (QFT) (white rectangles). In both cases the results of this processing are sequences. Subsequently, a learnable token is added as the first element of the sequence. These sequences are processed by the transformer architectures Tlc (light curves) and Ttab (tabular data). Finally, the processed token is transformed linearly and used for label prediction ![]() . In training we use cross-entropy ℋ(·, y) to optimize the model (purple rectangles). If both light curves and tabular information are used at the same time, we additionally minimize the cross-entropy of the prediction
. In training we use cross-entropy ℋ(·, y) to optimize the model (purple rectangles). If both light curves and tabular information are used at the same time, we additionally minimize the cross-entropy of the prediction ![]() resulted from the concatenation of the two processed tokens. In the diagram MLP, LL, and CAT refer to multi-layer perceptron, linear layer and concatenation in the embedding dimension, respectively. For more details see Methods.
resulted from the concatenation of the two processed tokens. In the diagram MLP, LL, and CAT refer to multi-layer perceptron, linear layer and concatenation in the embedding dimension, respectively. For more details see Methods.
Current usage metrics show cumulative count of Article Views (full-text article views including HTML views, PDF and ePub downloads, according to the available data) and Abstracts Views on Vision4Press platform.
Data correspond to usage on the plateform after 2015. The current usage metrics is available 48-96 hours after online publication and is updated daily on week days.
Initial download of the metrics may take a while.