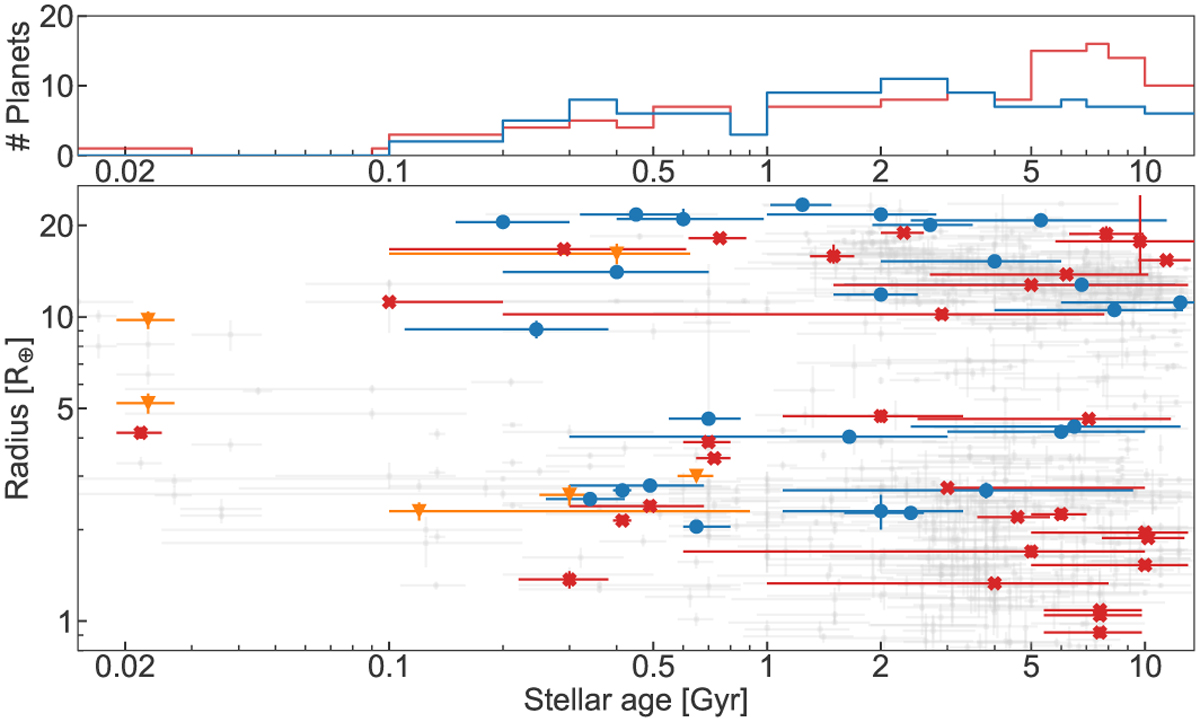
Fig. 8
Download original image
Planetary radius vs stellar age diagram of evaporation (H and He I) detections (blue circles), non-detections (red crosses), and non-conclusive observations (orange down-pointing triangles). Planetary radii and stellar ages are from Table M.1. The top panel shows the summed histogram of evaporation detections (blue line) and non-detections (red line) across stellar age. The grey points represent all known planets with radius and age determined with precision better than 30% and 50%, respectively (data from NASA Exoplanet Archive).
Current usage metrics show cumulative count of Article Views (full-text article views including HTML views, PDF and ePub downloads, according to the available data) and Abstracts Views on Vision4Press platform.
Data correspond to usage on the plateform after 2015. The current usage metrics is available 48-96 hours after online publication and is updated daily on week days.
Initial download of the metrics may take a while.