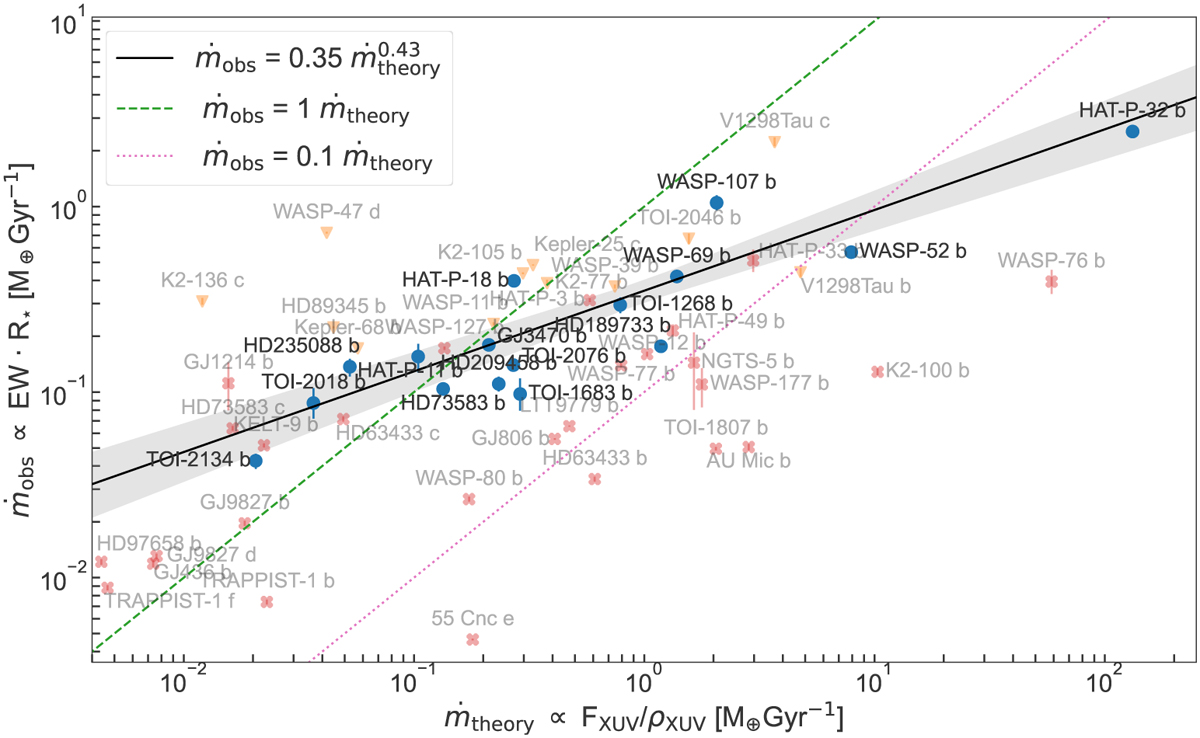
Fig. 7
Download original image
Relationship between the observed (ṁobs) and the theoretical (ṁtheory) energy-limited mass-loss rates. We define XUV until the He I ionisa-tion range (λ = 5–504 Å). The black line indicates the fitted relationship (shown in the legend) and the shaded area the 1σ uncertainty. He I observations are coded as blue circles for detections, red crosses for non-detections, orange down-pointing triangles for non-conclusive. We did not plot the error bars of ṁtheory due to the very large uncertainties associated with the FXUV values and its calculation. Every planet has its name labelled: in black for detections and the others in grey. The two new detections presented in this work, TOI-2018 b and TOI-1268 b, are in good agreement with the predicted trend.
Current usage metrics show cumulative count of Article Views (full-text article views including HTML views, PDF and ePub downloads, according to the available data) and Abstracts Views on Vision4Press platform.
Data correspond to usage on the plateform after 2015. The current usage metrics is available 48-96 hours after online publication and is updated daily on week days.
Initial download of the metrics may take a while.