Fig. 16
Download original image
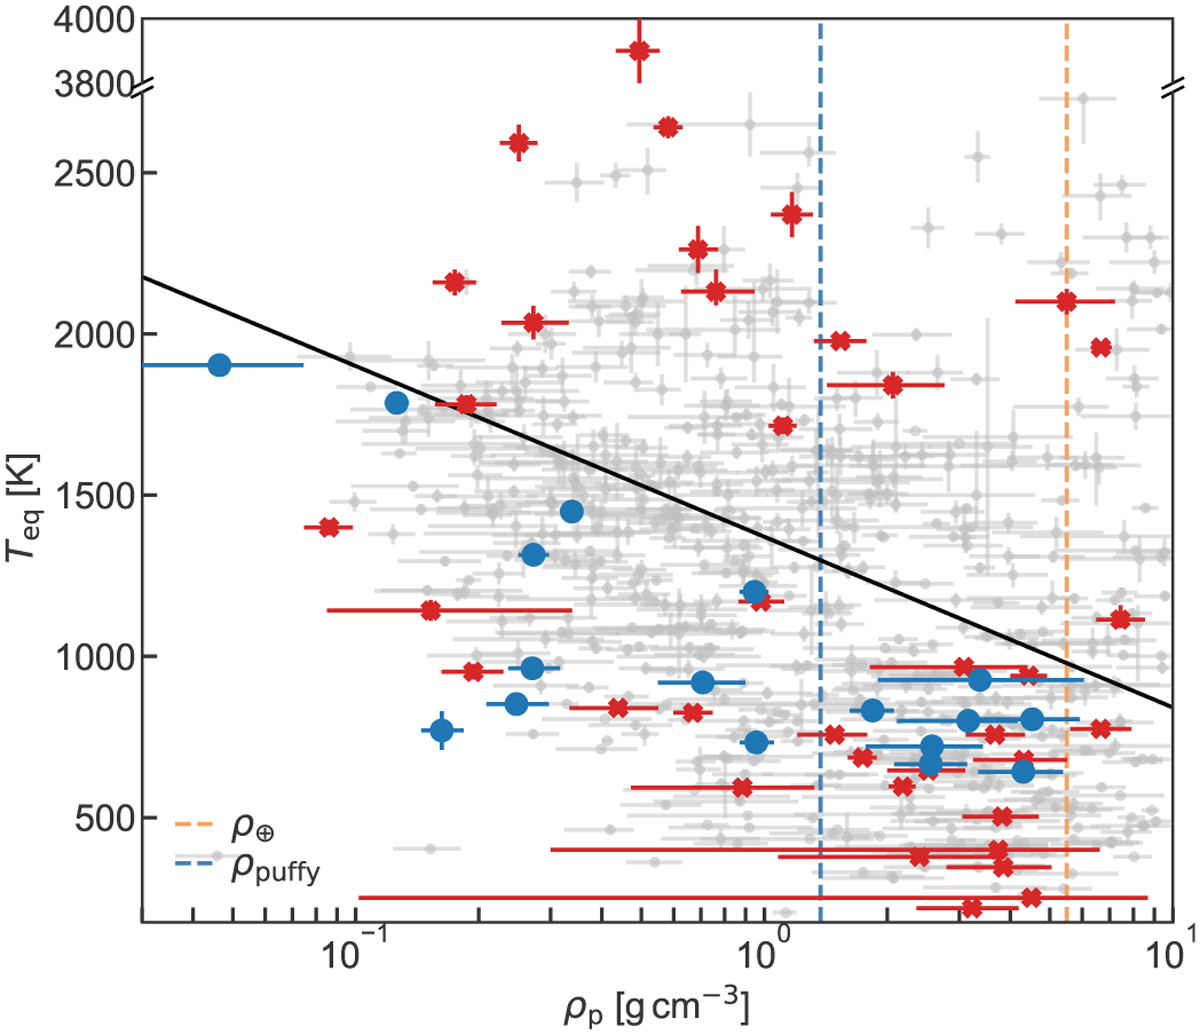
Equilibrium temperature (Teq) vs planet density (ρp) diagram for the He I detections (blue circles) and non-detections (red crosses). The black line (drawn by-eye) indicates the hinted upper boundary for the He I detections. The coloured dashed vertical lines indicate the Earth’s density (ρ⊕; orange line at ~5.5 g cm−3), and a representative density where the puffy planet population starts (ρpuffy; blue line at ~1.3 g cm−3; Luque & Pallé 2022). All known planets with Teq and ρp determined with a precision better than 50% are marked with grey dots (data from NASA Exoplanet Archive).
Current usage metrics show cumulative count of Article Views (full-text article views including HTML views, PDF and ePub downloads, according to the available data) and Abstracts Views on Vision4Press platform.
Data correspond to usage on the plateform after 2015. The current usage metrics is available 48-96 hours after online publication and is updated daily on week days.
Initial download of the metrics may take a while.