Fig. 11
Download original image
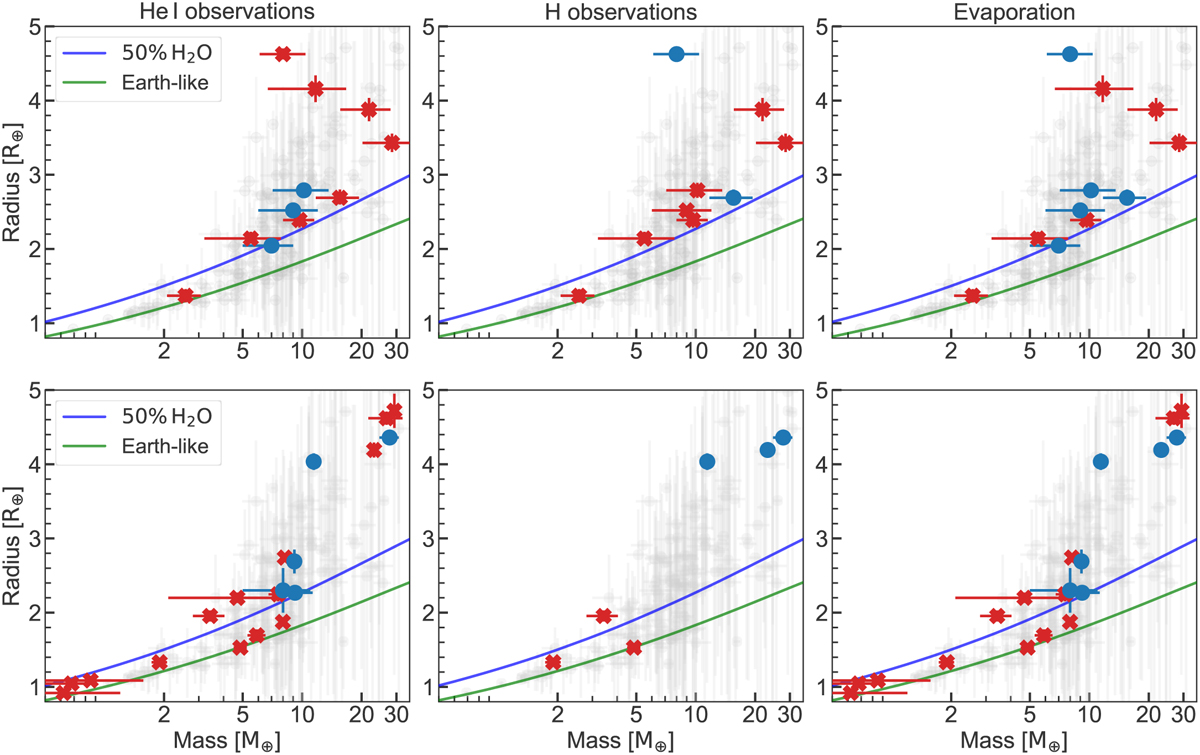
Radius-mass diagrams for planets with ages <1 Gyr (top panels) and >1 Gyr (bottom panels) with He I (left panels) and H (Hα or Lyα, middle panels) observations, and evaporation (combination of He I and/or H observations, right panels). Detections and non-detections are marked as blue circles and red crosses, respectively. The solid lines are the theoretical models from Zeng et al. (2019) for Earth-like (green) and 50% H2O+50% rocky (blue) compositions. The grey points represent all known planets with mass and radius determined with a precision better than 20% (data from NASA Exoplanet Archive).
Current usage metrics show cumulative count of Article Views (full-text article views including HTML views, PDF and ePub downloads, according to the available data) and Abstracts Views on Vision4Press platform.
Data correspond to usage on the plateform after 2015. The current usage metrics is available 48-96 hours after online publication and is updated daily on week days.
Initial download of the metrics may take a while.