Fig. 1
Download original image
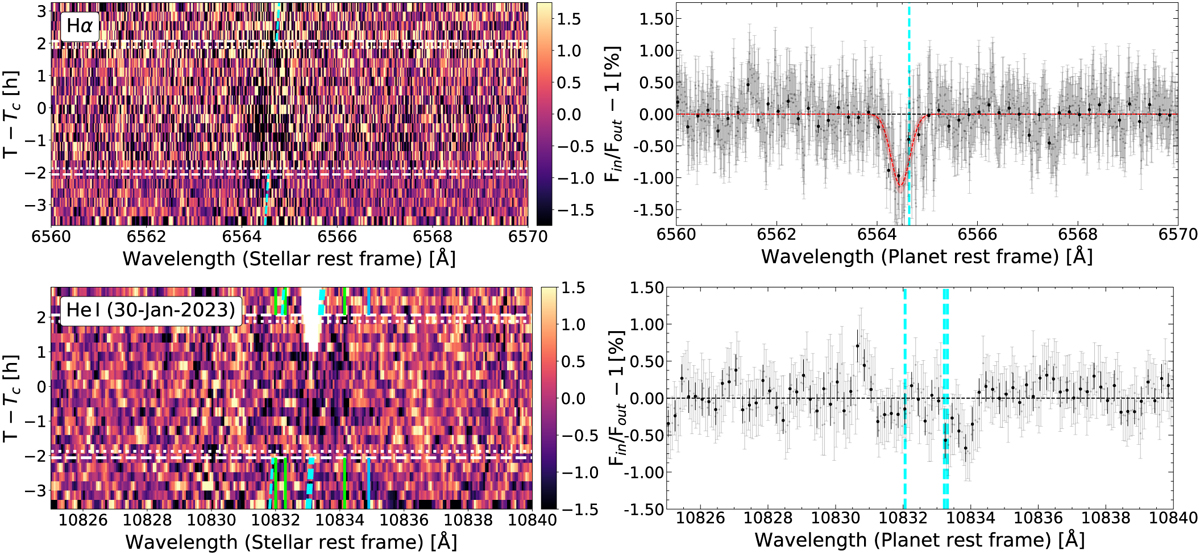
Residuals maps and transmission spectra around the Hα line (top panels) and He I NIR triplet (bottom panels) lines for TOI-1136 d observations. Hα results are the combination of HARPS-N and CARMENES VIS observations. He I triplet results are from CARMENES NIR observations. Left panels: residual maps in the stellar rest frame. Time since mid-transit time (Tc) is shown on the vertical axis, wavelength is on the horizontal axis, and relative absorption is colour-coded. The dashed and dotted white horizontal lines indicate the different contacts during the transit. The dashed cyan tilted lines indicate the predicted trace of the planetary signals. The solid green vertical lines indicate the position of the OH emission telluric lines. The solid blue line indicates the position of the H2O absorption telluric line. Right panels: planet transmission spectra (TS) in the planet rest frame. We show the original data in light grey and the data binned by 0.2 Å in black. When an absorption signal is fitted, a red line and shaded region show the best Gaussian fit model with its 1σ uncertainties. The dotted cyan vertical lines indicate the Hα (top) and the He I triplet (bottom) lines positions. All the wavelengths in this figure are referenced in a vacuum.
Current usage metrics show cumulative count of Article Views (full-text article views including HTML views, PDF and ePub downloads, according to the available data) and Abstracts Views on Vision4Press platform.
Data correspond to usage on the plateform after 2015. The current usage metrics is available 48-96 hours after online publication and is updated daily on week days.
Initial download of the metrics may take a while.