Fig. A.1.
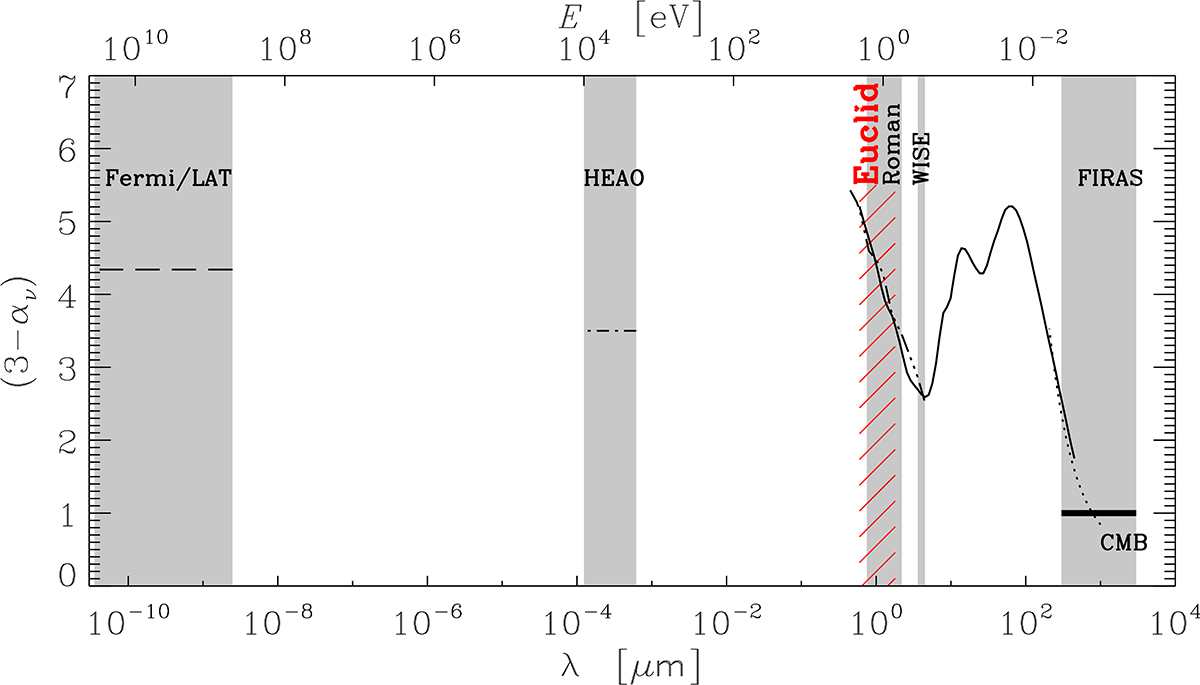
Download original image
The Compton-Getting dipole amplification, (3 − αν) shown for various wavelength data marked on the horizontal axis. For high-energy data the upper horizontal axis marks the corresponding energy, E. From left to right: dashes mark the amplification for the Fermi-LAT data, dashed-dotted line for the HEAO X-ray data, solid line for the mid- and near-IR data, dashed-triple-dotted line for the near-IR IGL at m0 ≥ 18 and the dotted line shows the amplification the far-IR CIB determined from FIRAS. See text for details. The range of wavelengths covered by each line is marked with shadow rectangles. Euclid is marked in red being the subject here.
Current usage metrics show cumulative count of Article Views (full-text article views including HTML views, PDF and ePub downloads, according to the available data) and Abstracts Views on Vision4Press platform.
Data correspond to usage on the plateform after 2015. The current usage metrics is available 48-96 hours after online publication and is updated daily on week days.
Initial download of the metrics may take a while.